The bar graph shows the distribution of 414 books collected by 10 different groups for a book drive. How many...
GMAT Problem-Solving and Data Analysis : (PS_DA) Questions
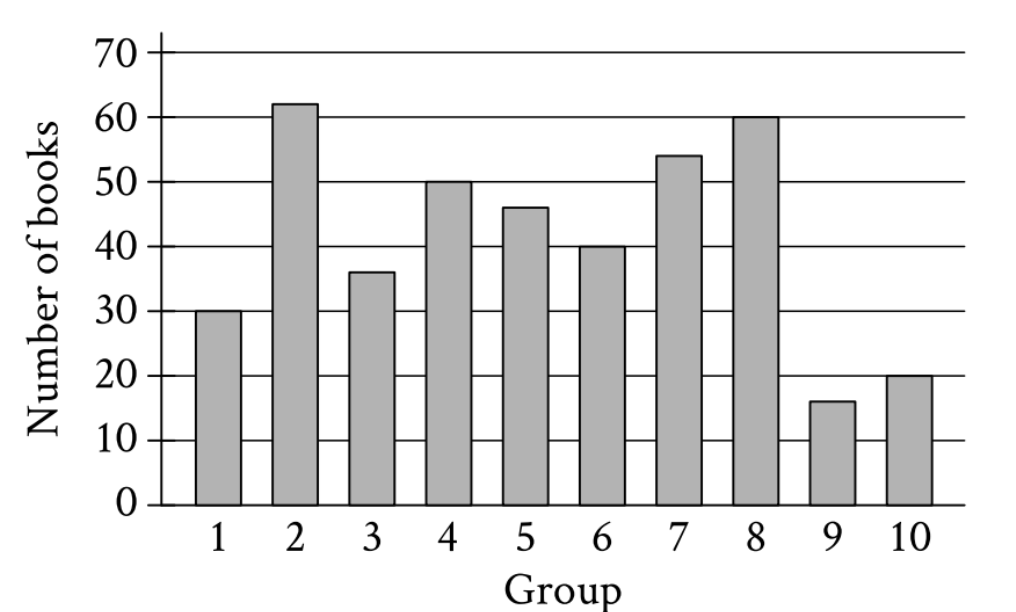
The bar graph shows the distribution of 414 books collected by 10 different groups for a book drive. How many books were collected by group 1?
1. TRANSLATE the question into what to look for
The question asks for the number of books collected by group 1, so I need to:
- Locate the bar labeled "1" on the x-axis
- Determine the height of that bar using the y-axis scale
2. TRANSLATE the bar height to a numerical value
• Find group 1's bar: It's the first bar on the left side of the graph
• Read the y-axis carefully:
- The scale goes from 0 to 70
- Grid lines mark intervals of 10 (0, 10, 20, 30, 40, 50, 60, 70)
- The top of group 1's bar aligns exactly with the 30 mark
• Therefore: Group 1 collected 30 books
Answer: 30
Why Students Usually Falter on This Problem
Most Common Error Path:
Weak TRANSLATE skill: Misreading the y-axis scale or miscounting grid lines
Students may:
- Estimate the bar height carelessly and read it as 20 or 40 instead of 30
- Misalign their eye level with the top of the bar, causing parallax error
- Not notice that each grid line represents an increment of 10
- Confuse group 1 with another group by looking at the wrong bar
This leads to stating an incorrect answer like 20, 25, or 40 instead of 30.
The Bottom Line:
This problem tests the fundamental skill of accurately reading data from a bar graph. The key is careful visual alignment—ensuring you're looking at the correct bar and precisely matching its height to the y-axis scale. Take your time to verify which bar corresponds to group 1 and where exactly the top of that bar aligns on the scale.