Two data sets of 23 integers each are summarized in the histograms shown. For each of the histograms, the first...
GMAT Problem-Solving and Data Analysis : (PS_DA) Questions
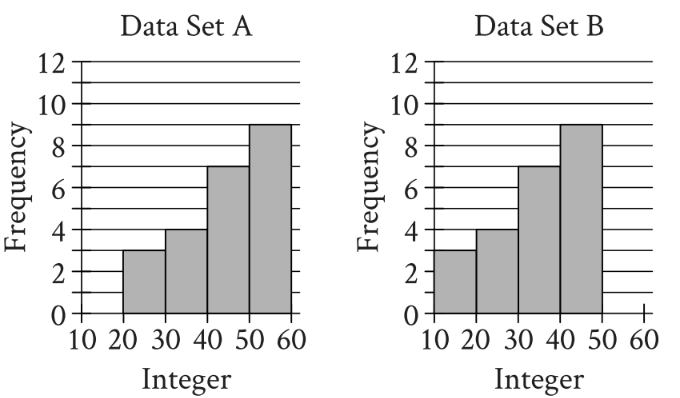
Two data sets of \(\mathrm{23}\) integers each are summarized in the histograms shown. For each of the histograms, the first interval represents the frequency of integers greater than or equal to \(\mathrm{10}\), but less than \(\mathrm{20}\). The second interval represents the frequency of integers greater than or equal to \(\mathrm{20}\), but less than \(\mathrm{30}\), and so on. What is the smallest possible difference between the mean of data set A and the mean of data set B?
Choose 1 answer:
\(\mathrm{0}\)
\(\mathrm{1}\)
\(\mathrm{10}\)
\(\mathrm{23}\)
1. TRANSLATE the histogram information
From Data Set A's histogram:
- Interval \([20, 30)\): 3 integers
- Interval \([30, 40)\): 4 integers
- Interval \([40, 50)\): 7 integers
- Interval \([50, 60)\): 9 integers
- Total: 23 integers
From Data Set B's histogram:
- Interval \([10, 20)\): 3 integers
- Interval \([20, 30)\): 4 integers
- Interval \([30, 40)\): 7 integers
- Interval \([40, 50)\): 9 integers
- Total: 23 integers
2. INFER the relationship between the data sets
Notice that the histograms have identical shapes, but Data Set A's values range from 20-60 while Data Set B's range from 10-50. The histograms are shifted by 10 units.
This tells us: \(\mathrm{mean(A)} \gt \mathrm{mean(B)}\), so the difference will be positive.
3. INFER the optimization strategy
Since we want the smallest possible difference, and we know \(\mathrm{mean(A)} - \mathrm{mean(B)} \gt 0\), we need to:
- Minimize the mean of Data Set A
- Maximize the mean of Data Set B
Key insight: The histogram only tells us how many integers fall in each interval, not the specific values. Within interval \([20, 30)\), the integers could be 20, 21, 22, ..., or 29. We can strategically choose:
- For Data Set A: Use the smallest value in each interval (the lower bound)
- For Data Set B: Use the largest value in each interval (upper bound minus 1, since intervals are "less than" the upper value)
4. Calculate the smallest possible mean for Data Set A
Using minimum values:
- 3 integers at 20
- 4 integers at 30
- 7 integers at 40
- 9 integers at 50
\(\mathrm{Mean_A(min)} = \frac{3×20 + 4×30 + 7×40 + 9×50}{23}\)
5. Calculate the largest possible mean for Data Set B
Using maximum values (remember: interval \([10, 20)\) means integers from 10 to 19):
- 3 integers at 19
- 4 integers at 29
- 7 integers at 39
- 9 integers at 49
\(\mathrm{Mean_B(max)} = \frac{3×19 + 4×29 + 7×39 + 9×49}{23}\)
6. SIMPLIFY to find the minimum difference
Difference = Mean_A(min) - Mean_B(max)
\(= \frac{(3×20 + 4×30 + 7×40 + 9×50) - (3×19 + 4×29 + 7×39 + 9×49)}{23}\)
Factor out from each term:
\(= \frac{3(20-19) + 4(30-29) + 7(40-39) + 9(50-49)}{23}\)
\(= \frac{3(1) + 4(1) + 7(1) + 9(1)}{23}\)
\(= \frac{3 + 4 + 7 + 9}{23}\)
\(= \frac{23}{23}\)
\(= 1\)
Answer: B. 1
Why Students Usually Falter on This Problem
Most Common Error Path:
Weak INFER skill: Students don't recognize the need for extremal reasoning. Instead, they calculate means using the midpoint of each interval (e.g., 25, 35, 45, 55 for Data Set A), thinking this is the standard approach for histogram data.
Using midpoints:
- \(\mathrm{Mean_A} = \frac{3×25 + 4×35 + 7×45 + 9×55}{23} ≈ 44.8\)
- \(\mathrm{Mean_B} = \frac{3×15 + 4×25 + 7×35 + 9×45}{23} ≈ 34.6\)
- Difference \(≈ 10.2\)
This may lead them to select Choice C (10).
Second Most Common Error:
Poor TRANSLATE reasoning: Students misread the histogram and incorrectly believe both data sets start at 10 (missing that Data Set A actually starts at 20). They then conclude that the histograms represent the same data with the same range, leading to a difference of 0.
This may lead them to select Choice A (0).
The Bottom Line:
This problem tests whether students can apply strategic optimization thinking to grouped data. The critical realization is that when data is presented in intervals rather than as specific values, you have flexibility in choosing where within each interval the values lie—and this flexibility must be exploited to answer the question. Simply calculating "a mean" without considering which specific configuration minimizes the difference is the most common pitfall.
\(\mathrm{0}\)
\(\mathrm{1}\)
\(\mathrm{10}\)
\(\mathrm{23}\)