A teacher recorded the test scores of students in her class and organized the data by score ranges. The bar...
GMAT Problem-Solving and Data Analysis : (PS_DA) Questions
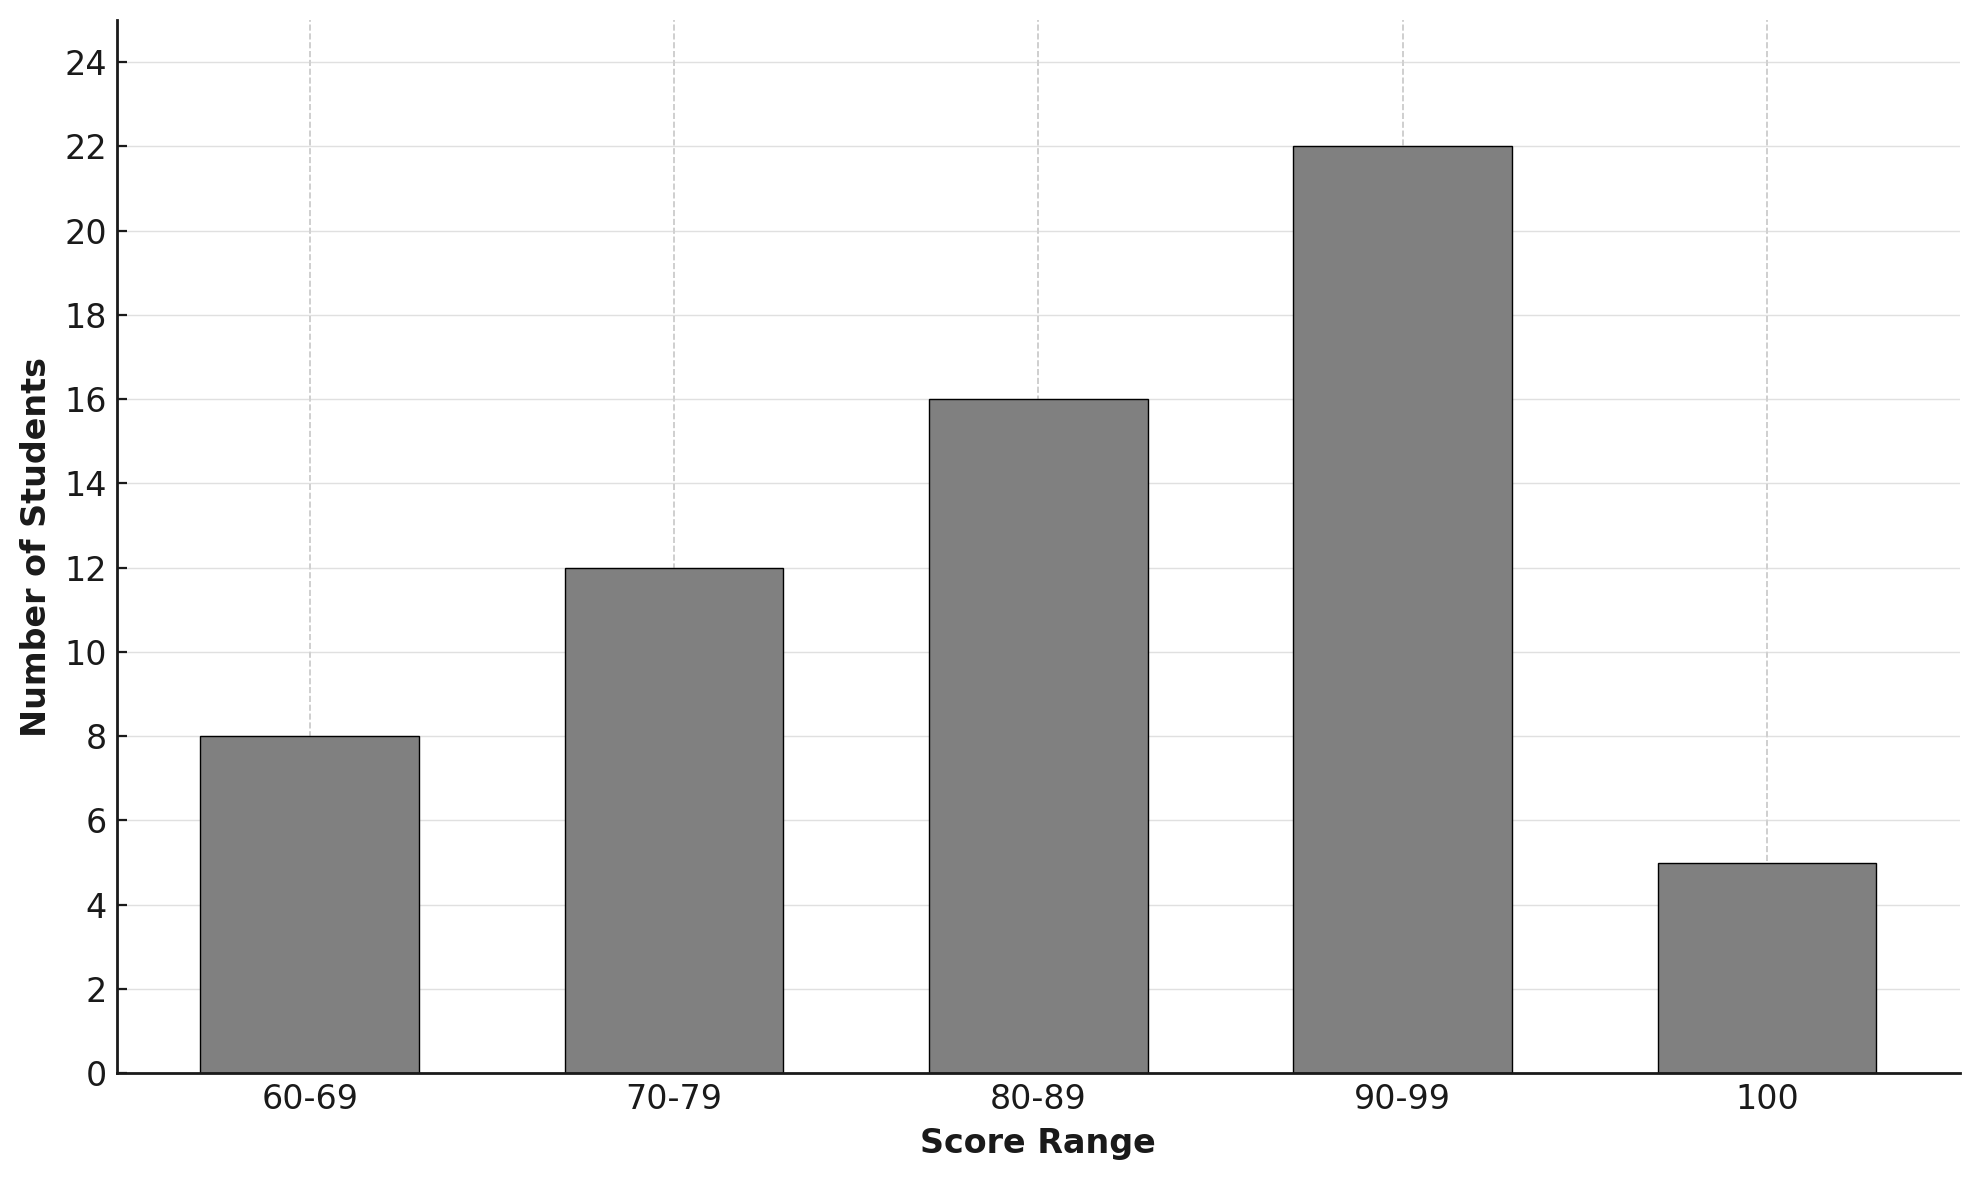
A teacher recorded the test scores of students in her class and organized the data by score ranges. The bar chart shows the number of students who scored in each range. How many students scored in the 80-89 range?
12
16
22
25
1. TRANSLATE the problem requirements
- What we're asked to find: The number of students who scored in the 80-89 range
- What this means: We need to find the height of one specific bar on the chart
2. TRANSLATE the visual information to numerical data
- Locate the correct bar: Find "80-89" on the horizontal axis (Score Range)
- Read the bar height:
- Look at where the top of the 80-89 bar aligns
- Trace horizontally from the bar top to the vertical axis
- Read the value on the "Number of Students" scale
- The bar reaches exactly to the 16 mark
Answer: 16 (Choice B)
Why Students Usually Falter on This Problem
Most Common Error Path:
Weak TRANSLATE skill: Reading the wrong bar due to rushing or visual misalignment
Students may look at an adjacent bar instead of the 80-89 bar:
- Reading the 70-79 bar (height = 12) instead → Choice A (12)
- Reading the 90-99 bar (height = 22) instead → Choice C (22)
This happens when students don't carefully verify which bar corresponds to the requested category before reading its height.
Second Most Common Error:
Poor TRANSLATE execution: Misreading the y-axis scale
Students may:
- Estimate between gridlines incorrectly
- Count tick marks instead of reading values
- Confuse the spacing of the scale
This leads to reading an incorrect value from the y-axis and selecting the wrong answer choice.
The Bottom Line:
This problem tests basic graph literacy—the ability to accurately match a category label with its visual representation and precisely read a scaled axis. The challenge lies not in complexity but in careful attention to detail. Students must slow down and verify they're reading the exact bar requested before determining its height.
12
16
22
25