A school tracked how many laptops were checked out each day during a week.The bar graph shows the number of...
GMAT Problem-Solving and Data Analysis : (PS_DA) Questions
- A school tracked how many laptops were checked out each day during a week.
- The bar graph shows the number of laptops checked out on each weekday.
- How many laptops were checked out on Wednesday? Refer to the figure.
1. TRANSLATE the question into what you need to find
- The question asks: "How many laptops were checked out on Wednesday?"
- What you need to do: Find the bar labeled "Wednesday" and determine its numerical value
2. INFER your approach to reading the graph
- Strategy: Locate Wednesday on the horizontal axis (x-axis), then read upward to see where the top of that bar aligns with the vertical axis (y-axis)
- The y-axis shows the "Number of Laptops Checked Out" with numbered intervals
3. TRANSLATE the visual bar height to a numerical value
- Find the bar for Wednesday
- Follow the top of the bar horizontally to the y-axis
- Read the value where the bar's top aligns with the scale
- The bar reaches exactly to the 39 mark on the y-axis
Answer: 39 (Choice C)
Why Students Usually Falter on This Problem
Most Common Error Path:
Weak TRANSLATE skill - Misreading the scale: Students may struggle with accurately reading the scale, especially if:
- They don't notice the intervals on the y-axis (e.g., if it counts by 5s or 10s)
- They miscount gridlines
- They read the value from the wrong day's bar (like Tuesday or Thursday instead of Wednesday)
- They read from the starting point of the bar instead of the endpoint
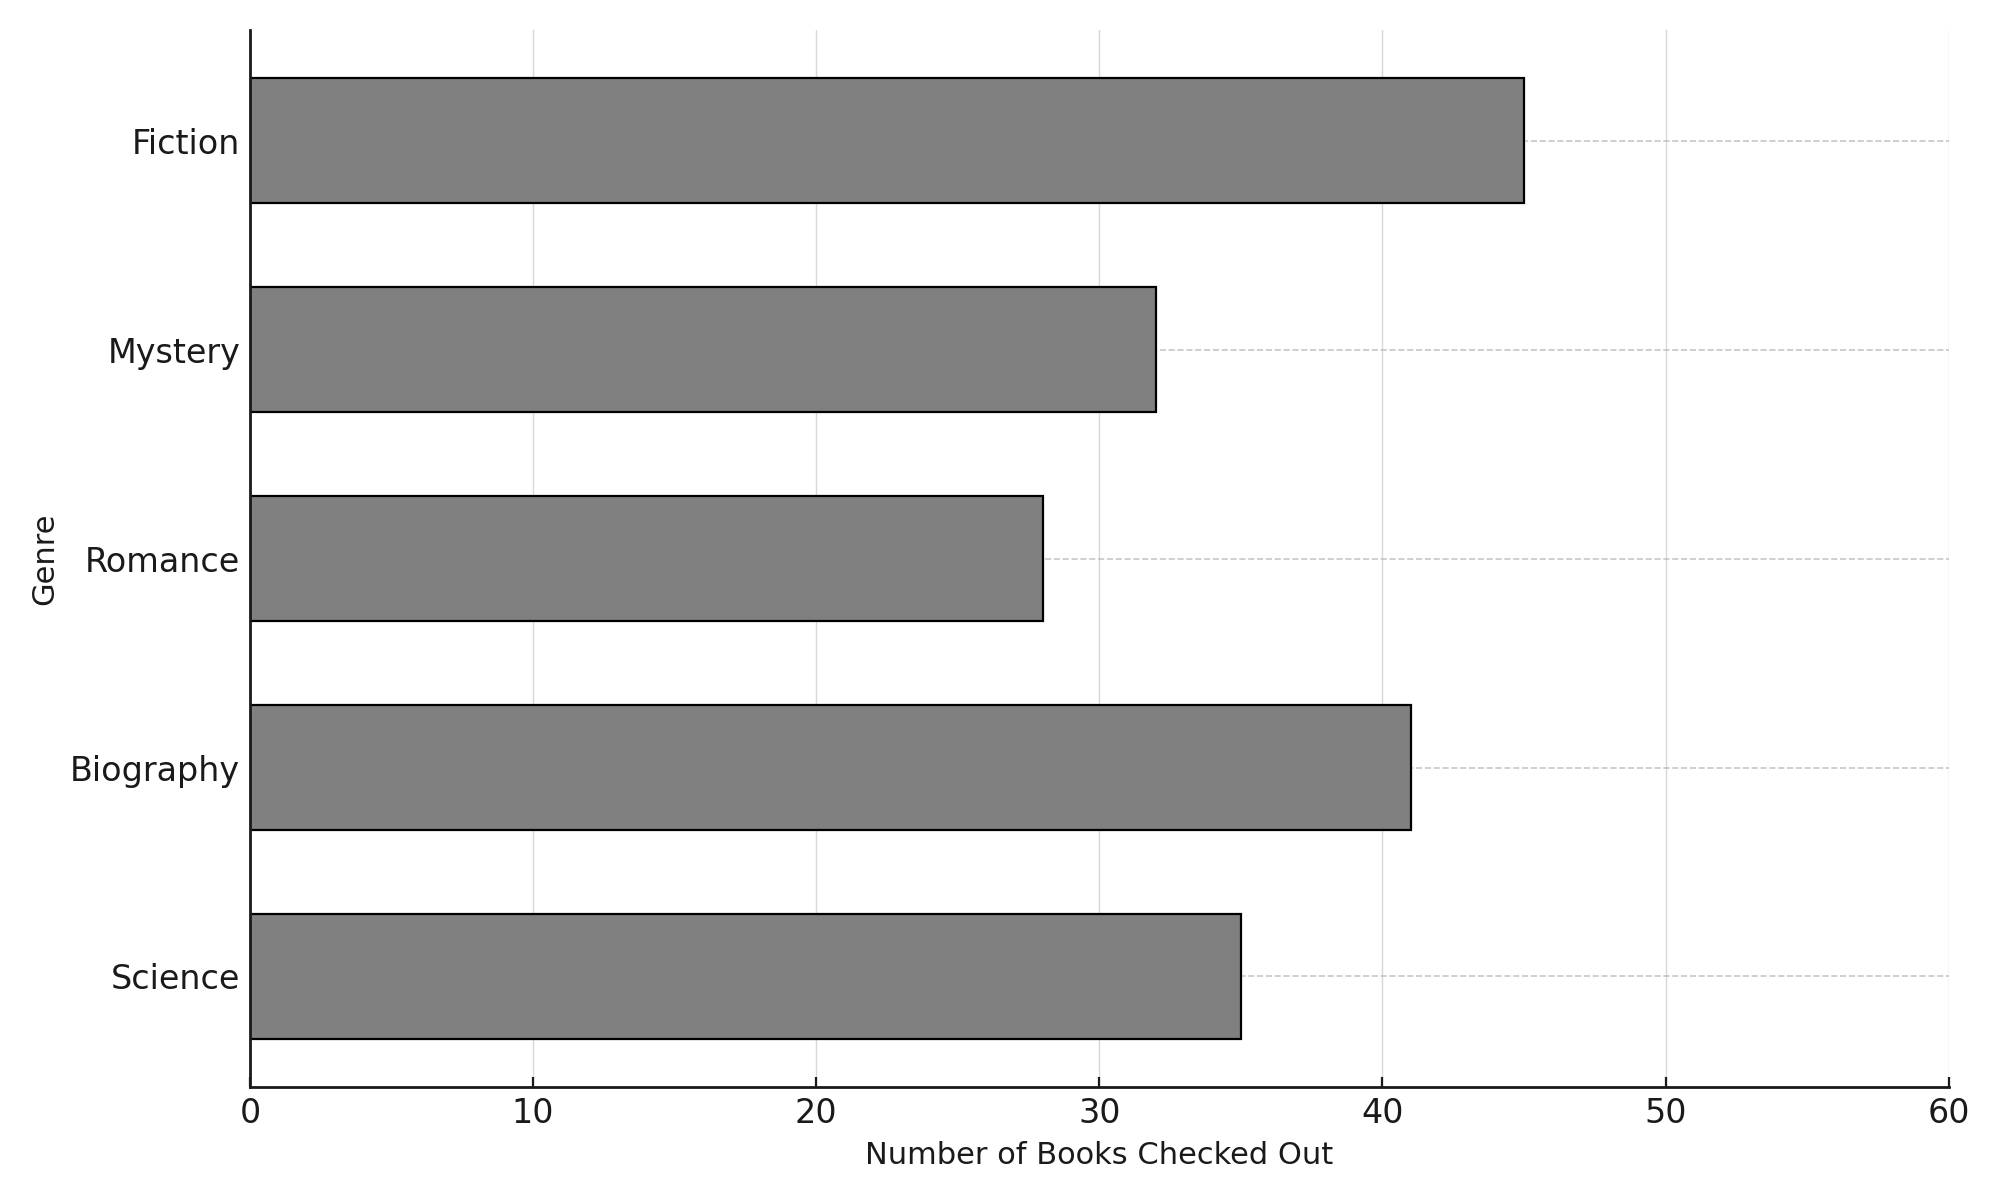
For example, if a student reads the wrong bar or miscounts, they might see 35 (Science's value if looking at the genre graph) and select Choice D (35), or see approximately 30 and select Choice B (30).
Second Most Common Error:
Poor TRANSLATE reasoning - Reading from wrong axis or wrong reference point: On a horizontal bar chart (like the genre graph shown), students might confuse which axis represents the values versus the categories. If the graph orientation doesn't match their expectation (vertical vs horizontal bars), they may:
- Read from the wrong end of the bar
- Confuse the category labels with numerical values
- Misidentify which bar corresponds to Wednesday
This confusion causes them to get stuck and guess, potentially selecting Choice A (22) or another visible value.
The Bottom Line:
This problem tests the fundamental skill of extracting numerical information from a visual display. Success requires careful attention to: (1) identifying the correct bar, (2) following it to the appropriate axis, and (3) accurately reading the scale value. While conceptually simple, execution errors in any of these steps lead directly to wrong answer selection.