The bar graph shows the distribution of the number of students from one school who were born in one of...
GMAT Problem-Solving and Data Analysis : (PS_DA) Questions
The bar graph shows the distribution of the number of students from one school who were born in one of four months.
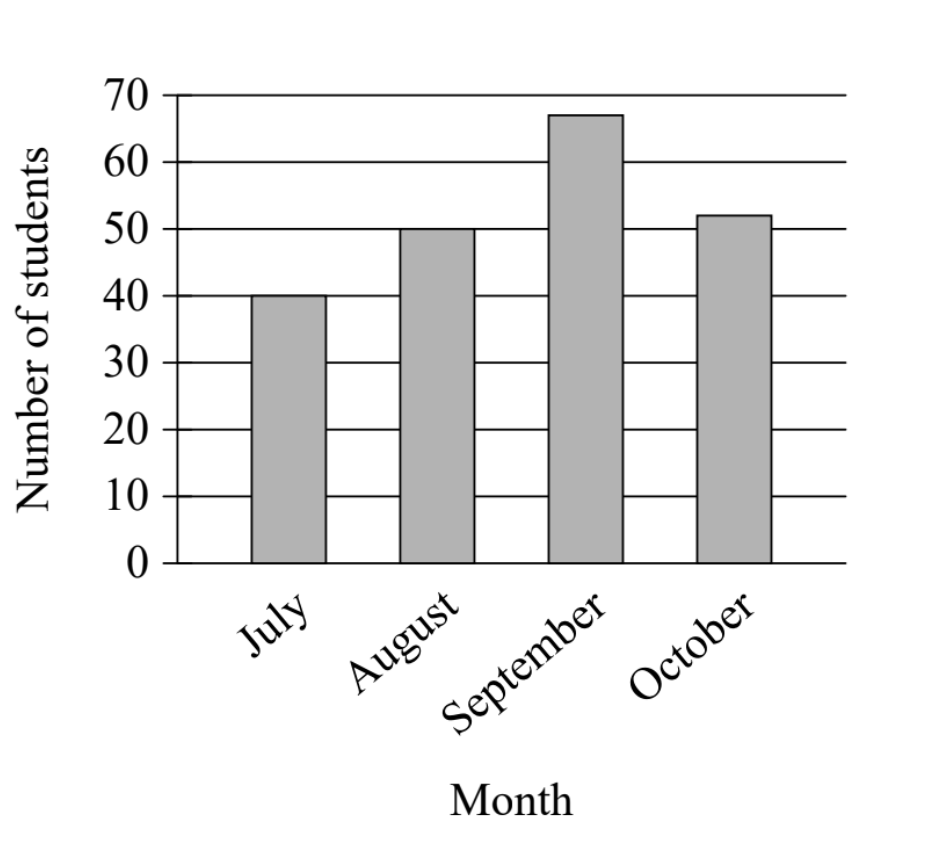
How many more students were born in August than were born in July?
90
50
40
10
1. TRANSLATE the question into mathematical terms
The question asks: "How many more students were born in August than were born in July?"
- TRANSLATE the phrase "how many more":
- This is asking for the difference between two quantities
- We need to subtract: August - July
- This will tell us how many additional students were born in August compared to July
2. TRANSLATE the bar graph information
Look at the bar graph and read the values:
- TRANSLATE the height of each bar to its numerical value:
- Find the July bar: It reaches to 40 on the y-axis
- Find the August bar: It reaches to 50 on the y-axis
3. Calculate the difference
Now that we know:
- August = 50 students
- July = 40 students
Perform the subtraction:
\(50 - 40 = 10\)
This means 10 more students were born in August than in July.
Answer: D. 10
Why Students Usually Falter on This Problem
Most Common Error Path:
Weak TRANSLATE skill: Students misinterpret what "how many more" means and select one of the individual values instead of finding the difference.
For example, a student might think the question is asking "How many students were born in August?" and read the August value (50) directly from the graph, or they might confuse which month the question is emphasizing and select July's value (40).
This may lead them to select Choice B (50) or Choice C (40).
Second Most Common Error:
Weak TRANSLATE skill: Students misread the comparative language and add the two values together instead of subtracting.
A student might see "August" and "July" mentioned together and incorrectly think they need to combine these values: \(50 + 40 = 90\).
This may lead them to select Choice A (90).
The Bottom Line:
This problem tests the fundamental skill of reading bar graphs and translating comparison language ("how many more") into the correct mathematical operation (subtraction). The answer choices are specifically designed to catch students who either select individual values without performing an operation, or who perform the wrong operation (addition instead of subtraction). Careful reading of both the graph and the question is essential.
90
50
40
10