The box plot above shows the distribution of lengths, in millimeters, of 50 manufactured parts measured during quality control. Due...
GMAT Problem-Solving and Data Analysis : (PS_DA) Questions
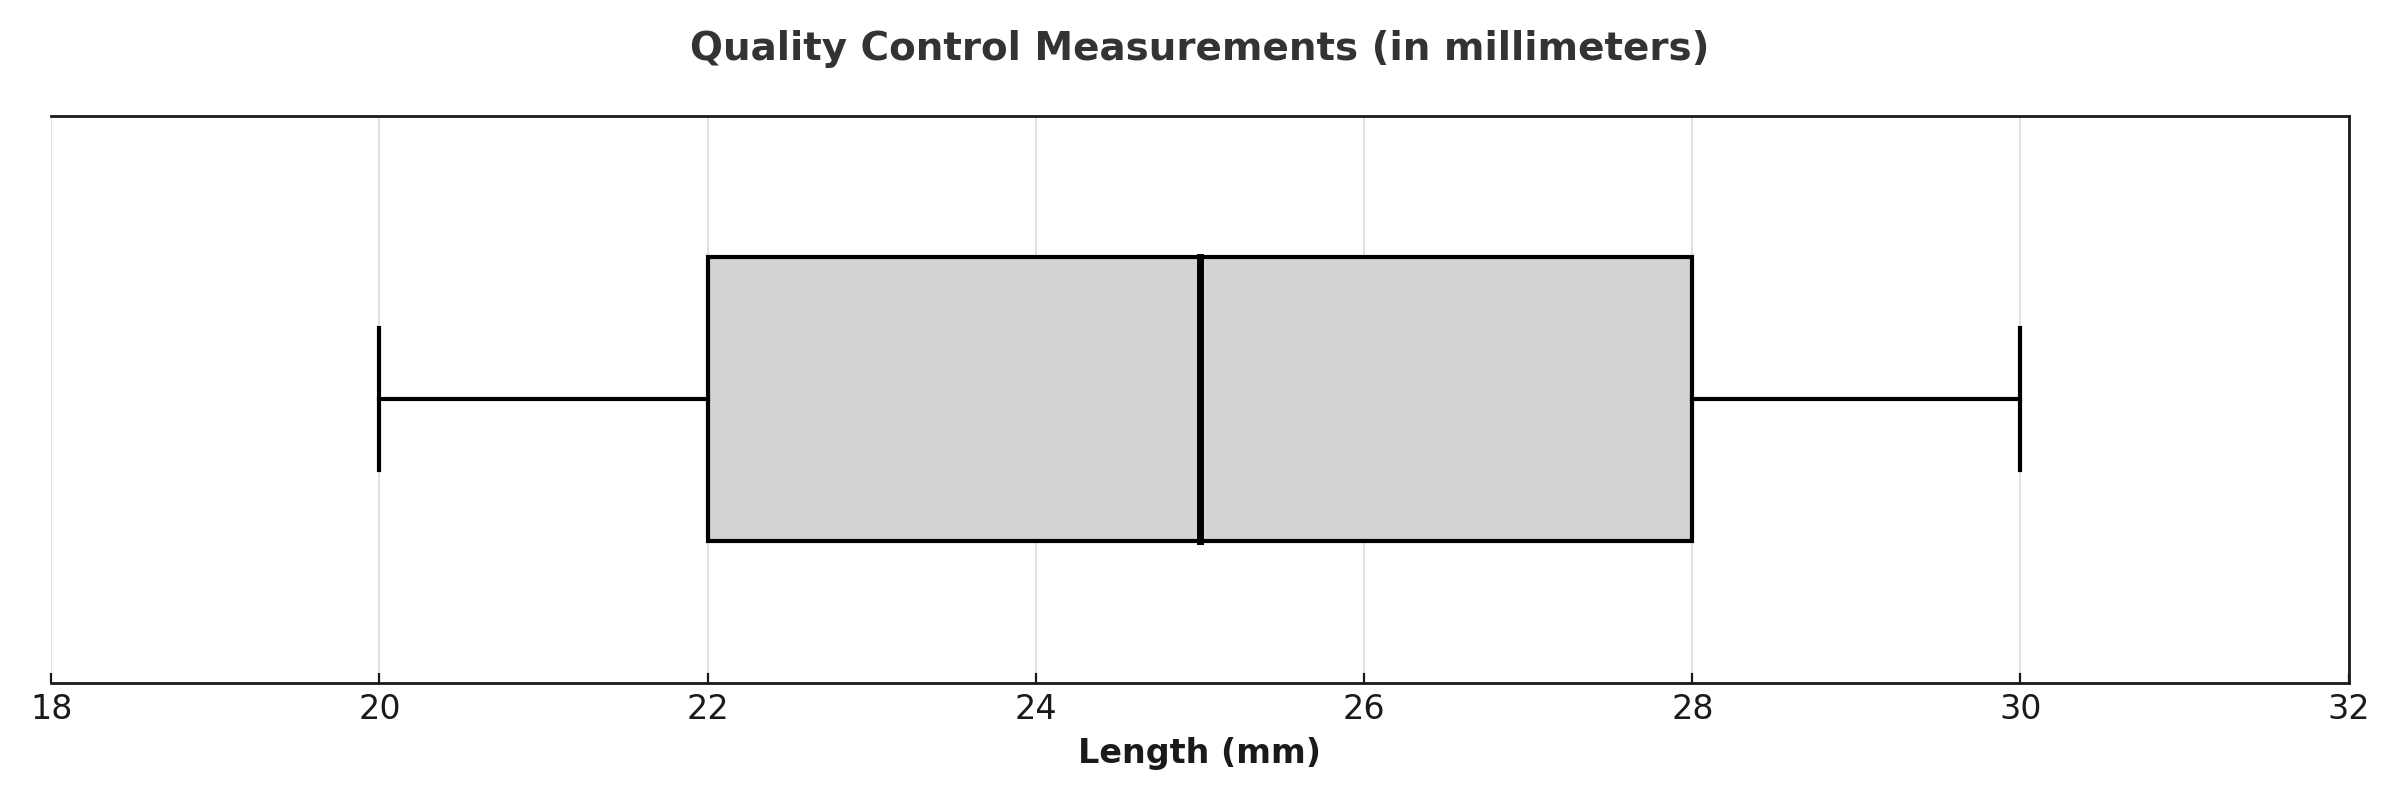
The box plot above shows the distribution of lengths, in millimeters, of 50 manufactured parts measured during quality control. Due to a calibration error, each measurement was \(\mathrm{3\,mm}\) less than the actual length. What is the interquartile range (IQR) of the actual lengths?
3
6
9
12
1. TRANSLATE the box plot information
Looking at the box plot carefully:
- Q1 (first quartile): The left edge of the gray box = 22 mm
- Q3 (third quartile): The right edge of the gray box = 28 mm
- Median: The vertical line inside the box ≈ 25 mm
The problem tells us: "each measurement was 3 mm less than the actual length"
This means: Actual length = Measured length + 3
2. SIMPLIFY to find the measured IQR
Using the IQR formula:
- IQR (measured) = Q3 - Q1
- IQR (measured) = 28 - 22 = 6 mm
3. INFER the key insight about transformations
Here's the critical question: When we add 3 mm to every measurement, what happens to the IQR?
Let's find the actual quartiles:
- Q1_actual = 22 + 3 = 25 mm
- Q3_actual = 28 + 3 = 31 mm
Now calculate the actual IQR:
- IQR (actual) = Q3_actual - Q1_actual
- IQR (actual) = 31 - 25 = 6 mm
Key insight: Both quartiles shifted up by 3 mm, so their difference stayed the same!
Mathematical principle: When you add (or subtract) the same constant to every value in a dataset, the spread doesn't change—only the center shifts. The IQR measures spread, so it remains unchanged.
Answer: B (6 mm)
Why Students Usually Falter on This Problem
Most Common Error Path:
Weak INFER skill: Students incorrectly think that since each individual measurement needs to be adjusted by 3 mm, the IQR should also be adjusted by 3 mm.
This faulty reasoning goes: "The measurements are off by 3 mm, so I need to add 3 to the IQR: 6 + 3 = 9 mm."
This error comes from not understanding what IQR represents. IQR is a measure of spread (the distance between Q3 and Q1), not a measure of center (like the mean or median). When you add a constant to all values:
- Measures of center shift by that constant (mean and median both increase by 3)
- Measures of spread stay the same (IQR, range, and standard deviation don't change)
This may lead them to select Choice C (9).
Second Most Common Error:
Poor TRANSLATE reasoning: Students misread the box plot and incorrectly identify the quartiles, perhaps confusing the median line with Q1 or Q3, or misreading the scale.
For example, if they think Q1 = 20 and Q3 = 28, they'd calculate IQR = 8 mm. Then they might either:
- Keep 8 mm as their answer (not matching any choice, leading to confusion)
- Add 3 to get 11 mm (also not matching, causing guessing)
This confusion about reading the box plot correctly causes them to get stuck and guess among the choices.
The Bottom Line:
This problem tests two things simultaneously: (1) your ability to read a box plot accurately, and (2) your understanding of how transformations affect measures of spread versus measures of center. The "adjustment by 3 mm" is designed to trap students who don't recognize that IQR measures spread, which is invariant under constant shifts.
3
6
9
12