The box plot summarizes 15 data values. What is the median of this data set?[Box plot showing a scale from...
GMAT Problem-Solving and Data Analysis : (PS_DA) Questions
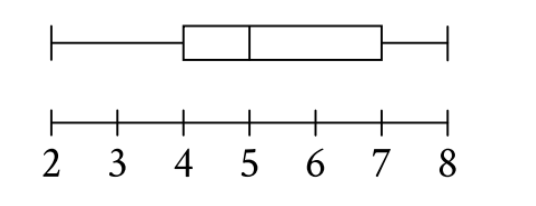
The box plot summarizes 15 data values. What is the median of this data set?
[Box plot showing a scale from 2 to 8, with box extending from approximately 4 to 6, median line at 5, left whisker to 2, right whisker to 8]
2
3
5
8
1. TRANSLATE the box plot components
When you look at a box plot, you need to identify its five key parts:
- Left whisker end: The minimum value (here: 2)
- Left edge of box: First quartile, Q1 (here: approximately 4)
- Vertical line inside the box: The median (here: 5)
- Right edge of box: Third quartile, Q3 (here: approximately 7)
- Right whisker end: The maximum value (here: 8)
2. INFER which component answers the question
The question asks: "What is the median of this data set?"
You need to INFER that the median is specifically represented by the vertical line INSIDE the box, not the edges of the box or the whiskers.
Looking at the box plot, the vertical line inside the box is located at 5 on the scale.
3. TRANSLATE the position to numerical value
Reading from the scale, the vertical line inside the box aligns with 5.
Answer: C. 5
Why Students Usually Falter on This Problem
Most Common Error Path:
Weak TRANSLATE skill: Students confuse which component of the box plot represents the median.
Some students see the box and think the median is at one of the box's edges. They might identify:
- The left edge of the box (Q1 at approximately 4), leading them toward selecting something close to Choice B (3)
- The minimum value at the left whisker (2), leading them to select Choice A (2)
- The maximum value at the right whisker (8), leading them to select Choice D (8)
These errors happen when students don't remember or properly TRANSLATE that the vertical line INSIDE the box (not the edges, not the whiskers) represents the median.
Second Most Common Error:
Missing conceptual knowledge: Students don't know what a box plot is or haven't learned the structure yet.
Without understanding box plot components, they might:
- Read any prominent feature (like the endpoints 2 and 8)
- Guess based on position without understanding the representation
- Calculate an average of visible numbers (2, 4, 5, 7, 8) unnecessarily
This leads to confusion and guessing among all answer choices.
The Bottom Line:
This problem tests whether students can read and interpret a box plot correctly. The key is knowing that the vertical line inside the box always represents the median. If you remember this single fact, the problem becomes a simple reading task rather than a calculation challenge.
2
3
5
8