The box plots summarize the test scores for students taught using two different teaching methods. Based on the box plots,...
GMAT Problem-Solving and Data Analysis : (PS_DA) Questions
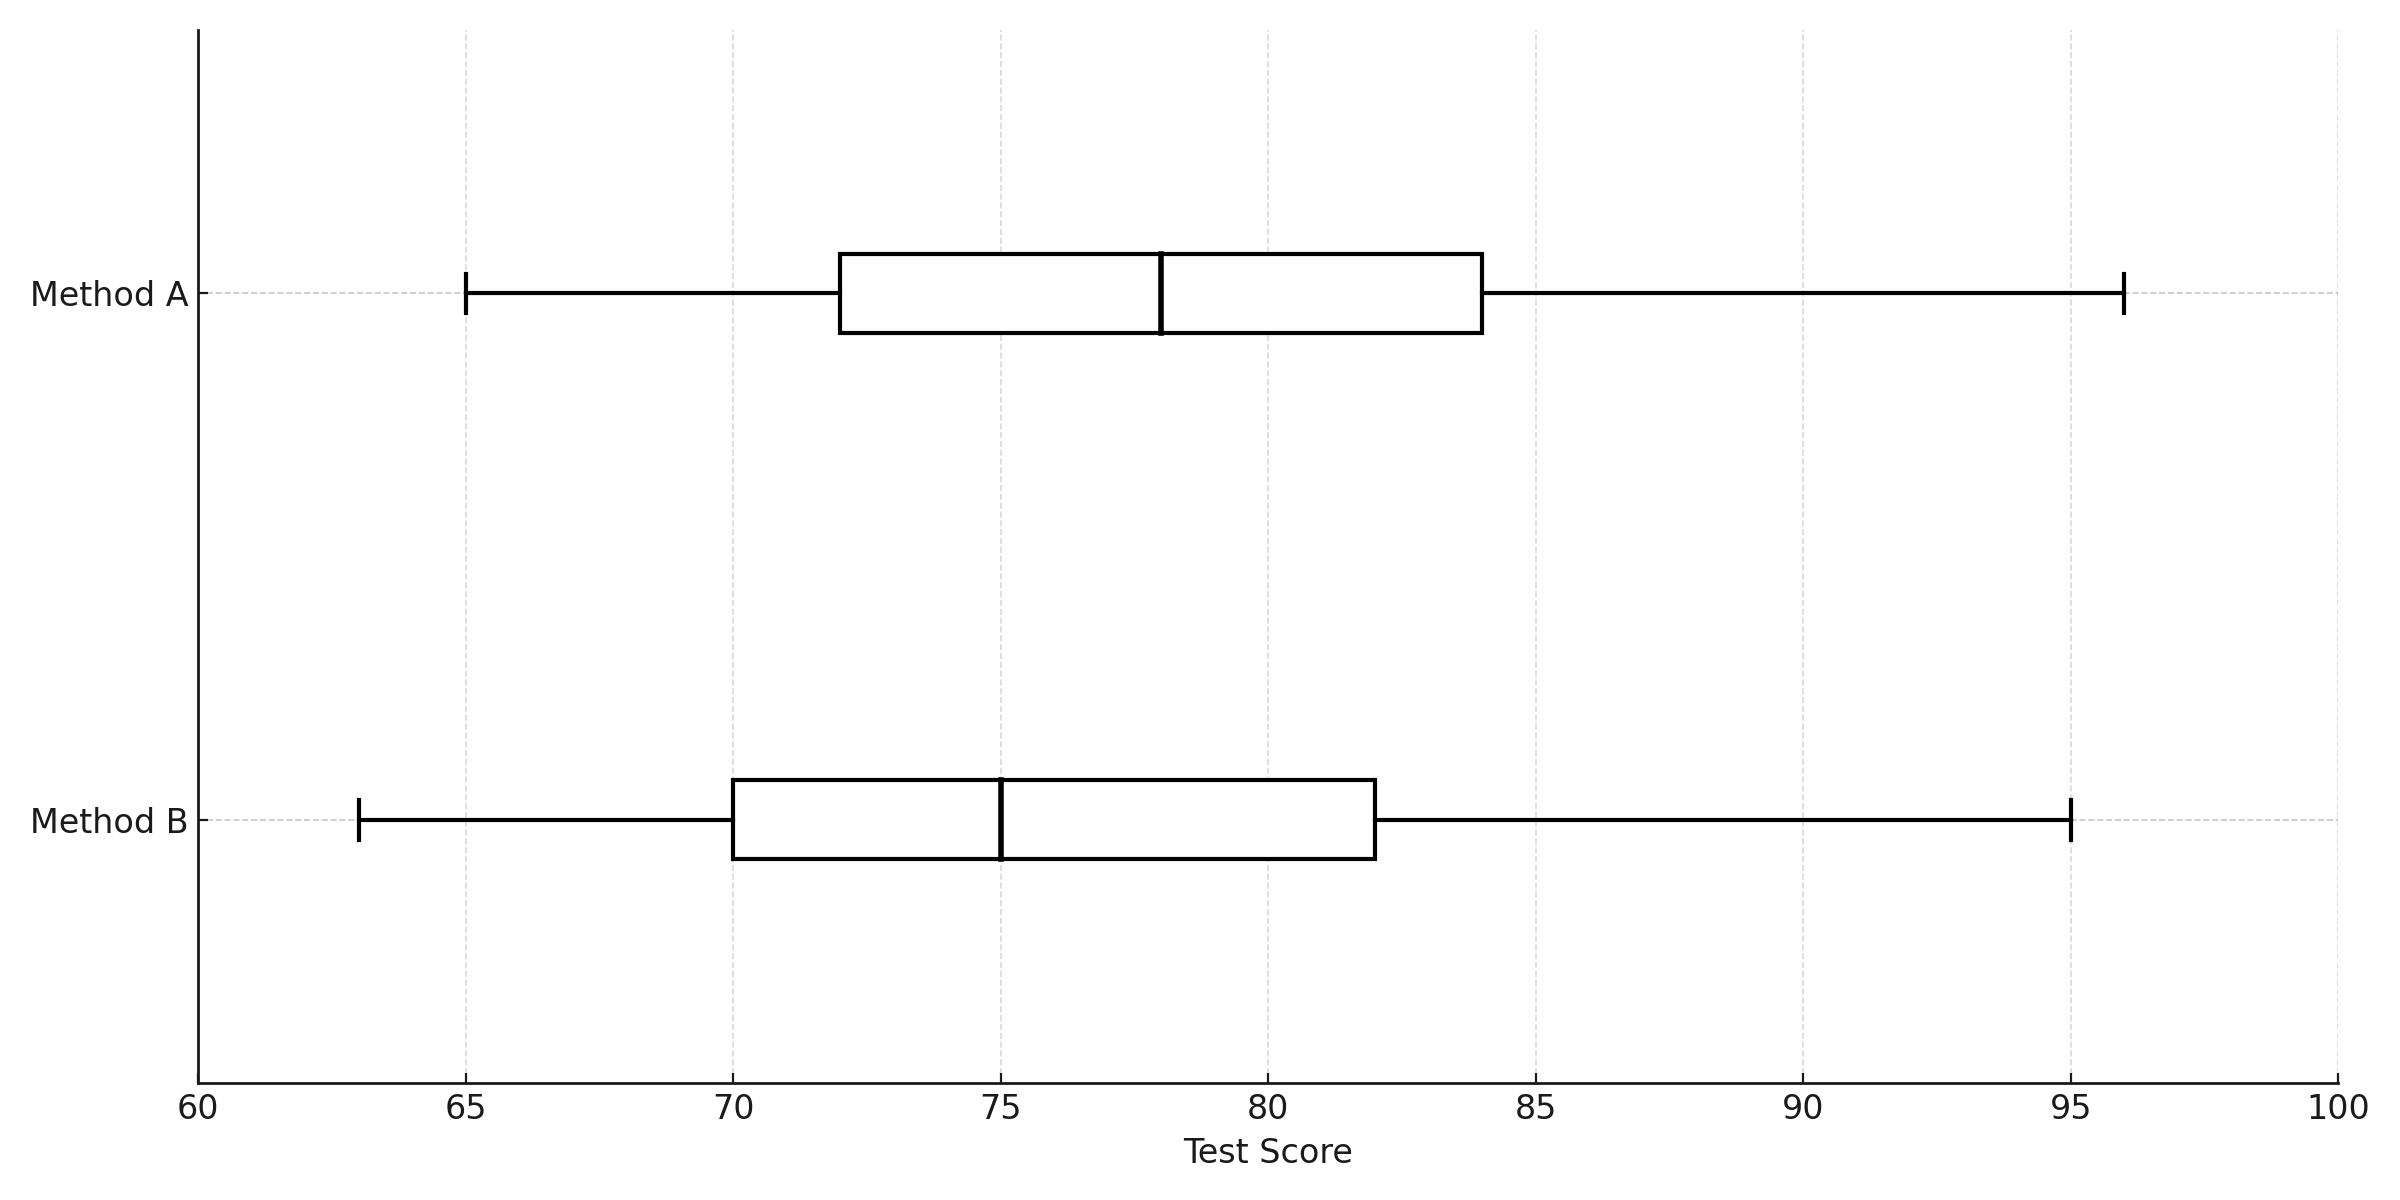
The box plots summarize the test scores for students taught using two different teaching methods. Based on the box plots, which of the following statements must be true?
The mean test score for Method A is greater than the mean test score for Method B.
The mean test score for Method A is less than the mean test score for Method B.
The median test score for Method A is greater than the median test score for Method B.
The median test score for Method A is less than the median test score for Method B.
1. TRANSLATE the box plot visual elements
When you look at a box plot, you need to identify what each component represents:
- The box itself: Spans from Q1 (25th percentile) to Q3 (75th percentile)
- The line inside the box: This is the median (50th percentile)
- The whiskers: Extend to the minimum and maximum values
For this problem, we need to focus on the vertical line inside each box, which shows the median.
2. TRANSLATE the median values from the graphs
Looking at the position of the vertical lines inside each box:
- Method A: The median line is positioned at approximately 78 on the Test Score axis
- Method B: The median line is positioned at approximately 75 on the Test Score axis
3. INFER which answer choices can be evaluated
Before comparing values, let's consider what information box plots provide:
- What box plots SHOW: The five-number summary (min, Q1, median, Q3, max)
- What box plots DON'T SHOW: The mean (average) or individual data points
This is crucial! Looking at the choices:
- Choices A and B ask about means → Cannot be determined from box plots
- Choices C and D ask about medians → Can be directly read from the graphs
4. Compare the medians
Now we can evaluate the remaining choices:
- Method A median: 78
- Method B median: 75
- Comparison: \(78 \gt 75\)
Choice C states: "The median test score for Method A is greater than the median test score for Method B."
- This matches our observation: \(78 \gt 75\) ✓
Choice D states: "The median test score for Method A is less than the median test score for Method B."
- This contradicts our observation: 78 is NOT less than 75 ✗
Answer: C
Why Students Usually Falter on This Problem
Most Common Error Path:
Weak TRANSLATE skill: Misidentifying the median location
Some students confuse the various components of a box plot. They might:
- Think the edges of the box represent the median (those are actually Q1 and Q3)
- Focus on the whisker endpoints instead of the line inside the box
- Misread the scale and identify incorrect values
If a student reads Method A's median as the Q1 value (~72) instead of the actual median (~78), they might conclude \(72 \lt 75\), which would lead them to select Choice D (The median test score for Method A is less than the median test score for Method B).
Second Most Common Error:
Missing conceptual knowledge: Not understanding box plot limitations
Students who don't realize that box plots show only the five-number summary might attempt to determine means from the graphs. They might:
- Assume the median equals the mean
- Try to "eyeball" where the mean might be based on the box shape
- Believe choices A or B can be verified
Since the box for Method B appears slightly more symmetric or spread differently, students might make assumptions about the mean and confidently select Choice A or Choice B, not realizing these cannot be determined from the given information.
The Bottom Line:
This problem tests two distinct skills: (1) the mechanical ability to read a box plot correctly and identify the median, and (2) the conceptual understanding of what information box plots provide versus what they don't. Students who master box plot interpretation know to look for the line inside the box and understand that means require information beyond the five-number summary.
The mean test score for Method A is greater than the mean test score for Method B.
The mean test score for Method A is less than the mean test score for Method B.
The median test score for Method A is greater than the median test score for Method B.
The median test score for Method A is less than the median test score for Method B.