The graph shows the total cost and revenue functions for a small business manufacturing widgets. The total cost includes both...
GMAT Algebra : (Alg) Questions
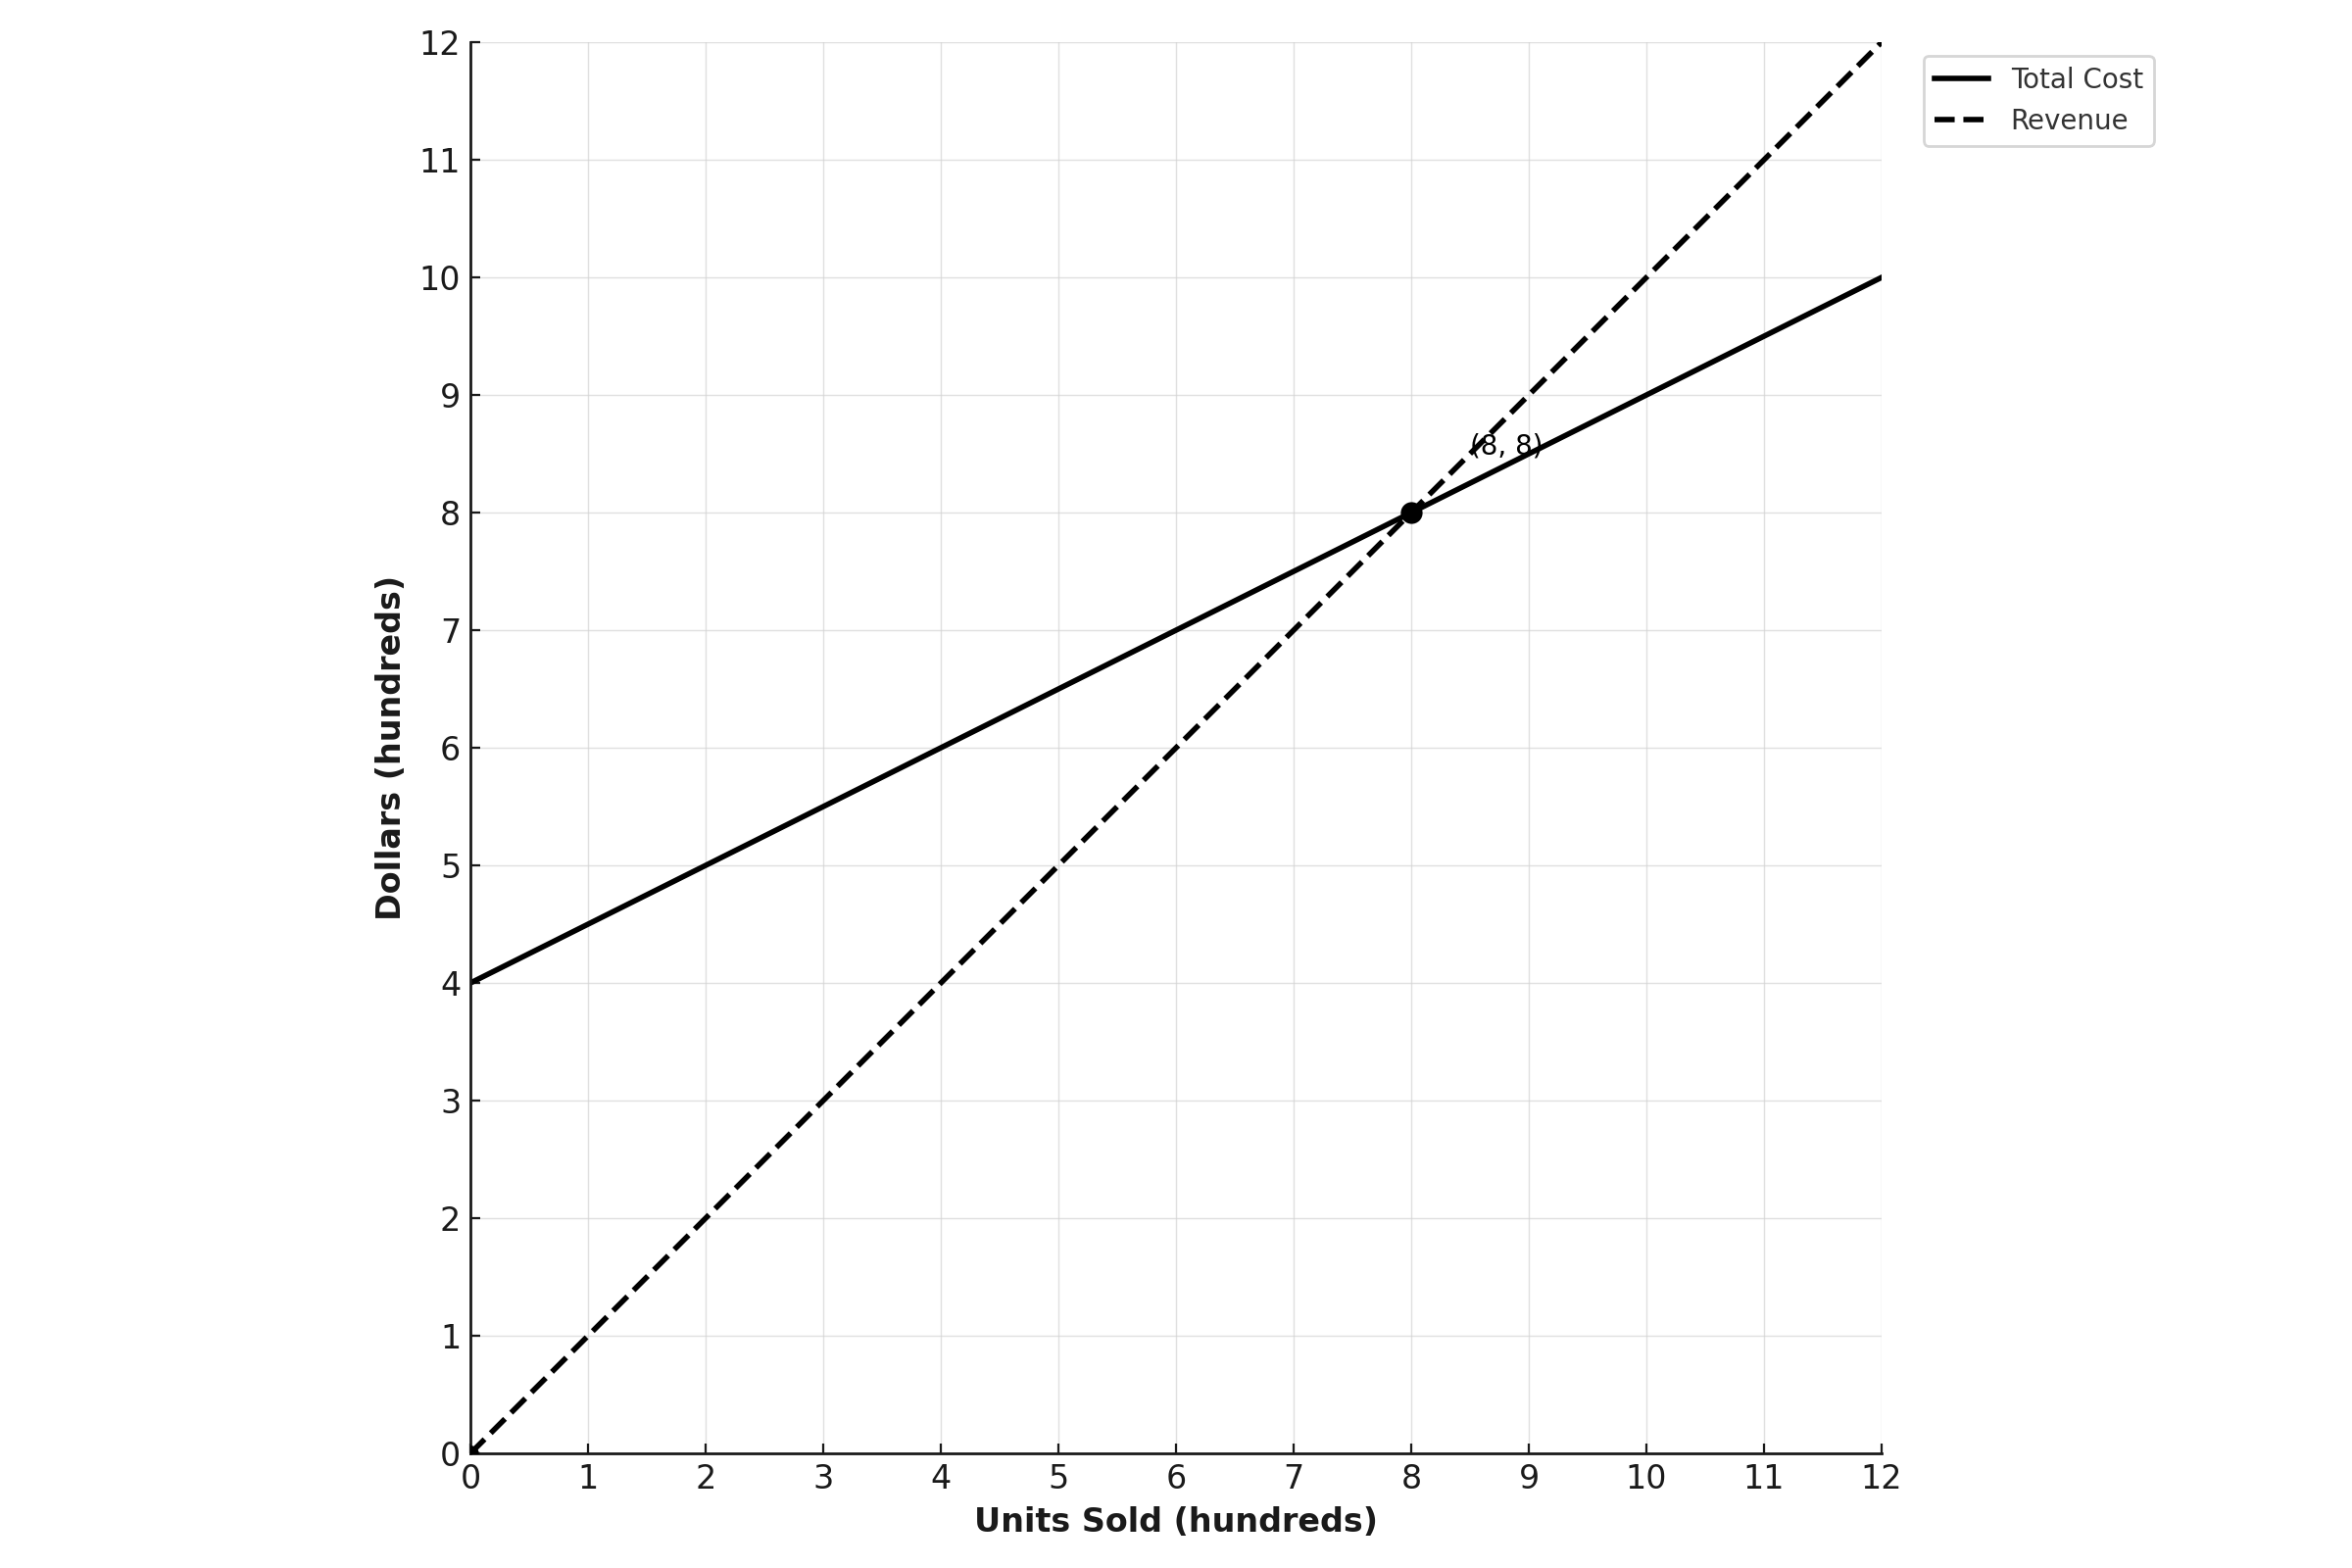
The graph shows the total cost and revenue functions for a small business manufacturing widgets. The total cost includes both fixed costs and variable production costs per unit. At what point (units sold, dollars) does the business break even?
\((4, 6)\)
\((6, 7)\)
\((8, 8)\)
\((10, 6)\)
1. TRANSLATE the business question into a mathematical requirement
The question asks "when does the business break even?"
- TRANSLATE this business term:
- Break even = Total Cost equals Revenue
- Mathematically: \(\mathrm{Total\ Cost = Revenue}\)
- Graphically: Where do these two lines intersect?
2. VISUALIZE by identifying the key elements on the graph
- Locate the two lines:
- Solid line = Total Cost (starts at \(\mathrm{y = 4}\), showing fixed costs of $400)
- Dashed line = Revenue (starts at origin)
- Find where they cross:
- There's a marked point (shown with a dot) where both lines meet
- This is the intersection point we need
3. VISUALIZE the coordinates by reading from the graph
- Read the x-coordinate (horizontal):
- The intersection occurs at \(\mathrm{x = 8}\)
- This means 8 hundreds = 800 units sold
- Read the y-coordinate (vertical):
- The intersection occurs at \(\mathrm{y = 8}\)
- This means 8 hundreds = $800 (both cost and revenue)
4. Verify the answer makes sense
- At 800 units sold:
- Total Cost = $800
- Revenue = $800
- Profit = $0 ✓ (This confirms break-even)
Answer: \(\mathrm{(8, 8)}\) - Choice C
Why Students Usually Falter on This Problem
Most Common Error Path:
Weak TRANSLATE skill: Student doesn't connect "break even" with "intersection point"
Some students may understand break-even conceptually but don't realize it means finding where the lines cross. Instead, they might:
- Look for a specific point on one line only
- Try to calculate something from the graph instead of just reading coordinates
- Confuse break-even with maximum profit or some other concept
This leads to confusion and random selection among answer choices.
Second Most Common Error:
Poor VISUALIZE execution: Misreading the graph coordinates
Students might:
- Confuse which line is which (reading from Total Cost instead of the intersection)
- Miscount the gridlines (reading 7 or 9 instead of 8)
- Read only one coordinate correctly but miss the other
For example, if they misread and think the intersection is at \(\mathrm{(4, 6)}\), they might select Choice A \(\mathrm{(4, 6)}\). Or if they read it as \(\mathrm{(6, 7)}\), they might select Choice B \(\mathrm{(6, 7)}\).
The Bottom Line:
This problem tests whether students can bridge business terminology with graphical analysis. Success requires both understanding what "break even" means mathematically and accurately reading coordinates from a visual representation. The actual mathematics is simple—the challenge is in the interpretation and precision of graph reading.
\((4, 6)\)
\((6, 7)\)
\((8, 8)\)
\((10, 6)\)