The line graphed in the xy-plane below models the total cost, in dollars, for a cab ride, y, in a...
GMAT Algebra : (Alg) Questions
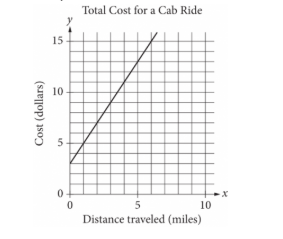
The line graphed in the xy-plane below models the total cost, in dollars, for a cab ride, \(\mathrm{y}\), in a certain city during nonpeak hours based on the number of miles traveled, \(\mathrm{x}\). According to the graph, what is the cost for each additional mile traveled, in dollars, of a cab ride?
1. TRANSLATE the question
The question asks: "What is the cost for each additional mile traveled?"
- Key phrase: "each additional mile"
- What this means mathematically: This is asking for the rate of change—how much the cost increases for every 1-mile increase in distance
- In graph terms: This is the slope of the line
2. VISUALIZE the graph to identify clear points
Look at the graph and find points where the line crosses grid intersections clearly:
- Point 1: (1, 5) — At 1 mile, the cost is $5
- Point 2: (2, 7) — At 2 miles, the cost is $7
- Point 3: (5, 13) — At 5 miles, the cost is $13
You can also identify:
- Y-intercept: (0, 3) — At 0 miles, there's a $3 initial fee
3. SIMPLIFY using the slope formula
Apply the slope formula using any two points. Let's use (1, 5) and (2, 7):
- Slope = \(\frac{\mathrm{y_2 - y_1}}{\mathrm{x_2 - x_1}}\)
- Slope = \(\frac{7 - 5}{2 - 1}\)
- Slope = \(\frac{2}{1}\)
- Slope = 2
The slope is 2, which means the cost increases by $2 for each additional mile.
Answer: A. $2.00
Why Students Usually Falter on This Problem
Most Common Error Path:
Weak TRANSLATE skill: Not recognizing that "cost for each additional mile" means finding the slope
Many students see the graph and understand it shows cost vs. distance, but they don't make the critical connection that "cost per mile" is the slope. Instead, they might:
- Look at the y-intercept and select Choice C ($3.00) — but this is the initial flat fee, not the per-mile cost
- Look at the total cost when x = 1 and select Choice D ($5.00) — but this is the total cost for 1 mile (initial fee + 1 mile charge), not the per-mile rate
Second Most Common Error:
Poor VISUALIZE execution: Misreading points on the graph or choosing the wrong reference point
Some students might try to calculate slope but use (0, 0) as a point, thinking the line starts at the origin. If they calculate slope using (0, 0) and (5, 13):
- Slope = \(\frac{13}{5} = 2.6\)
This leads them to select Choice B ($2.60), which is incorrect because (0, 0) is not actually on the line—the line crosses the y-axis at (0, 3), not the origin.
The Bottom Line:
This problem tests whether students can translate a real-world question about rate into the mathematical concept of slope, then accurately read a graph to calculate it. The trap answers are designed to catch students who confuse different components of the linear model (initial fee vs. per-mile rate vs. total cost) or who misidentify points on the graph.