The graph shown models the number of candy bars a certain machine wraps with a label in x seconds. According...
GMAT Algebra : (Alg) Questions
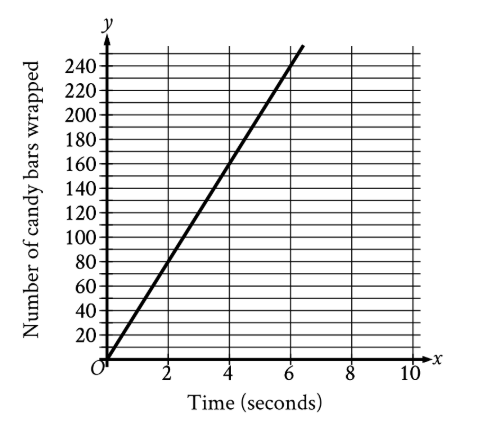
The graph shown models the number of candy bars a certain machine wraps with a label in x seconds. According to the graph, what is the estimated number of candy bars the machine wraps with a label per second?
\(\mathrm{2}\)
\(\mathrm{40}\)
\(\mathrm{78}\)
\(\mathrm{80}\)
1. TRANSLATE the question
- The question asks: "what is the estimated number of candy bars the machine wraps with a label per second?"
- Key phrase: "per second" - this means rate (how many candy bars for each second of time)
2. INFER what mathematical concept matches this question
- When we see "per second" in a graph where:
- x-axis = time (seconds)
- y-axis = quantity (candy bars)
- We need to find: How much does y change when x increases by 1?
- This is the slope of the line!
- The slope tells us the rate of change - exactly what "per second" is asking for
3. TRANSLATE coordinates from the graph
Looking at the graph, identify two clear points the line passes through:
- Point 1: \(\mathrm{(0, 0)}\) - at 0 seconds, 0 candy bars
- Point 2: \(\mathrm{(2, 80)}\) - at 2 seconds, 80 candy bars
You could also use \(\mathrm{(4, 160)}\) or other visible points, but \(\mathrm{(0, 0)}\) and \(\mathrm{(2, 80)}\) are easiest to read.
4. Apply the slope formula and SIMPLIFY
- Slope formula: \(\mathrm{m = \frac{y_2 - y_1}{x_2 - x_1}}\)
- Substitute the points:
\(\mathrm{m = \frac{80 - 0}{2 - 0}}\)
\(\mathrm{m = \frac{80}{2}}\)
\(\mathrm{m = 40}\) - This means 40 candy bars are wrapped per second
Answer: B. 40
Why Students Usually Falter on This Problem
Most Common Error Path:
Weak INFER skill: Not connecting "per second" to the concept of slope
Students might think "per second" means they should look at what happens at \(\mathrm{x = 1}\) second or \(\mathrm{x = 2}\) seconds. Looking at the graph, at \(\mathrm{x = 2}\), the y-value is 80. A student might think this is the answer because they read the coordinates but didn't understand that "per second" requires calculating the rate (slope), not just reading a single y-value.
This may lead them to select Choice D (80).
Second Most Common Error:
Incomplete SIMPLIFY execution: Reading coordinates incorrectly or using the wrong points
If a student misreads the graph and thinks the line passes through \(\mathrm{(2, 78)}\) instead of \(\mathrm{(2, 80)}\), they would calculate:
- \(\mathrm{m = \frac{78 - 0}{2 - 0} = \frac{78}{2} = 39}\)
Since 78 is an answer choice and close to their calculation, this may lead them to select Choice C (78).
Third Error Path:
TRANSLATE confusion: Mixing up which variable represents rate
A very confused student might think the answer is how many seconds per candy bar rather than candy bars per second, leading to calculations like \(\mathrm{\frac{2}{80}}\) or similar backwards reasoning. However, since none of the decimals appear in the choices, this would cause confusion and guessing.
The Bottom Line:
The key challenge is recognizing that "per second" on a graph means finding the slope (rate of change). Students who treat this as a simple reading-the-graph problem rather than a rate-calculation problem will select wrong answers that represent y-values at specific points rather than the slope of the line.
\(\mathrm{2}\)
\(\mathrm{40}\)
\(\mathrm{78}\)
\(\mathrm{80}\)