The graph above shows a model of the population of a city, in millions, for a 25-year period. The model...
GMAT Advanced Math : (Adv_Math) Questions
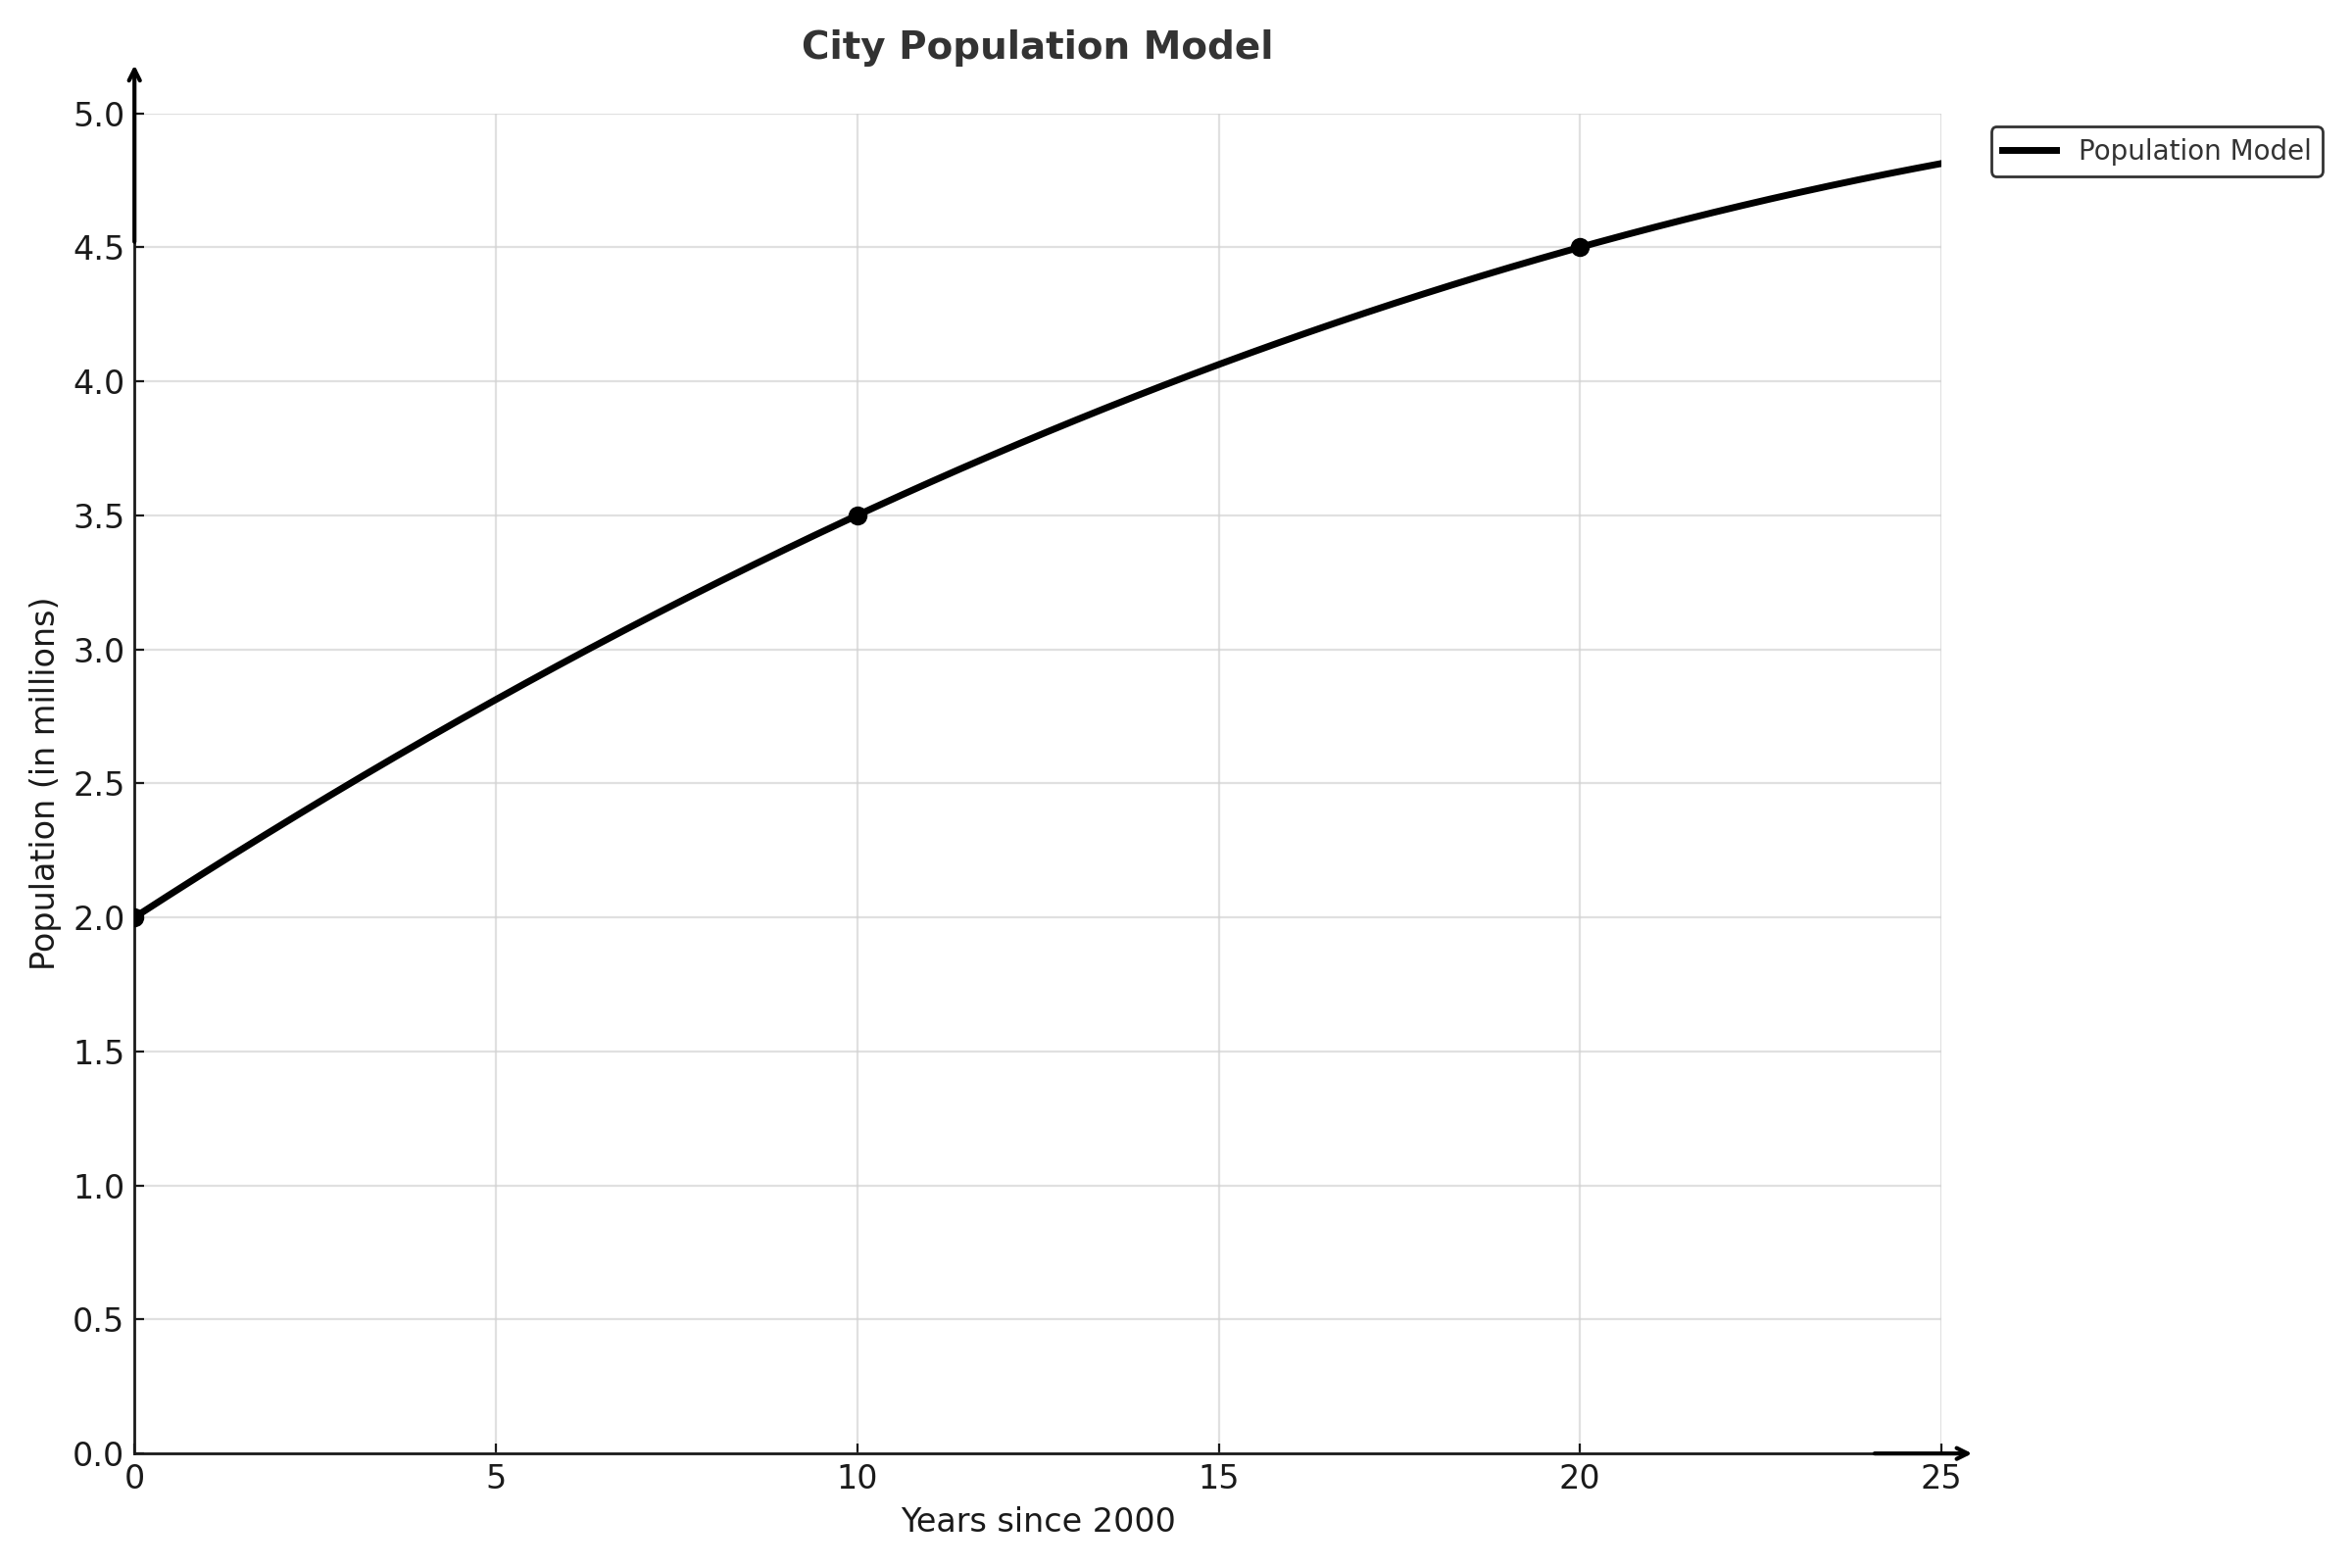
The graph above shows a model of the population of a city, in millions, for a 25-year period. The model gives the population \(\mathrm{P}\) at \(\mathrm{t}\) years since the beginning of the year 2000. According to the model, by how many people did the population of the city increase from the beginning of 2010 to the beginning of 2020?
1. TRANSLATE the time information into graph coordinates
The problem asks about population change from "beginning of 2010" to "beginning of 2020."
- The x-axis shows "Years since 2000," so we need to convert:
- Beginning of 2010: \(\mathrm{t = 2010 - 2000 = 10}\)
- Beginning of 2020: \(\mathrm{t = 2020 - 2000 = 20}\)
2. TRANSLATE by reading population values from the graph
Now locate these t-values on the graph and read the corresponding populations:
- At \(\mathrm{t = 10}\):
- Find 10 on the x-axis
- Move vertically up to the curve
- Read across to the y-axis: \(\mathrm{P = 3.5}\) million
- There's a dot marking this point on the graph
- At \(\mathrm{t = 20}\):
- Find 20 on the x-axis
- Move vertically up to the curve
- Read across to the y-axis: \(\mathrm{P = 4.5}\) million
- There's a dot marking this point on the graph
3. INFER what calculation answers the question
The question asks "by how many people did the population increase?"
- "Increase" means we need the difference between populations
- We subtract the earlier population from the later population:
- \(\mathrm{Increase = P(2020) - P(2010)}\)
- \(\mathrm{Increase = 4.5 - 3.5 = 1.0}\) million
4. TRANSLATE the final answer to match the question's request
The question asks for the answer in "people," not "millions of people."
- Convert: \(\mathrm{1.0\text{ million} = 1,000,000\text{ people}}\)
Answer: 1,000,000 (acceptable forms: 1000000, 1,000,000)
Why Students Usually Falter on This Problem
Most Common Error Path:
Weak TRANSLATE skill: Students misread the graph values, particularly confusing the y-axis scale. They might read 3.5 as 4.0 or 4.5 as 5.0 because they're not carefully aligning the point with the gridlines.
For example, if they read the values as \(\mathrm{P(10) = 3.0}\) and \(\mathrm{P(20) = 4.0}\), they would calculate:
- \(\mathrm{Increase = 4.0 - 3.0 = 1.0}\) million \(\mathrm{= 1,000,000}\)
This would coincidentally give the same answer, but if they read \(\mathrm{P(10) = 4.0}\) and \(\mathrm{P(20) = 4.5}\), they'd get 500,000, which is wrong.
Second Most Common Error:
Weak TRANSLATE skill: Students correctly find the increase as 1.0 million but forget to convert to actual count. They might answer "1" or "1.0" instead of "1,000,000" because they don't notice that the question specifically asks "by how many people" (requiring a count, not a value in millions).
This causes confusion about what form the answer should take, potentially leading to an incorrect response format.
Third Common Error:
Weak INFER skill: Students subtract in the wrong order (2010 population minus 2020 population), getting a negative result of -1,000,000. While some might recognize this is wrong because population increase can't be negative, others might report the magnitude without understanding the directionality issue.
This reveals a conceptual misunderstanding about what "increase" means mathematically.
The Bottom Line:
This problem tests careful graph reading and attention to units. The math itself is straightforward (simple subtraction), but students must accurately extract information from a visual representation and ensure their final answer matches the units requested in the question. Most errors stem from rushing through the reading phase rather than calculation mistakes.