The bar chart displays the number of books donated by eight classrooms to a library drive.Each bar corresponds to a...
GMAT Problem-Solving and Data Analysis : (PS_DA) Questions
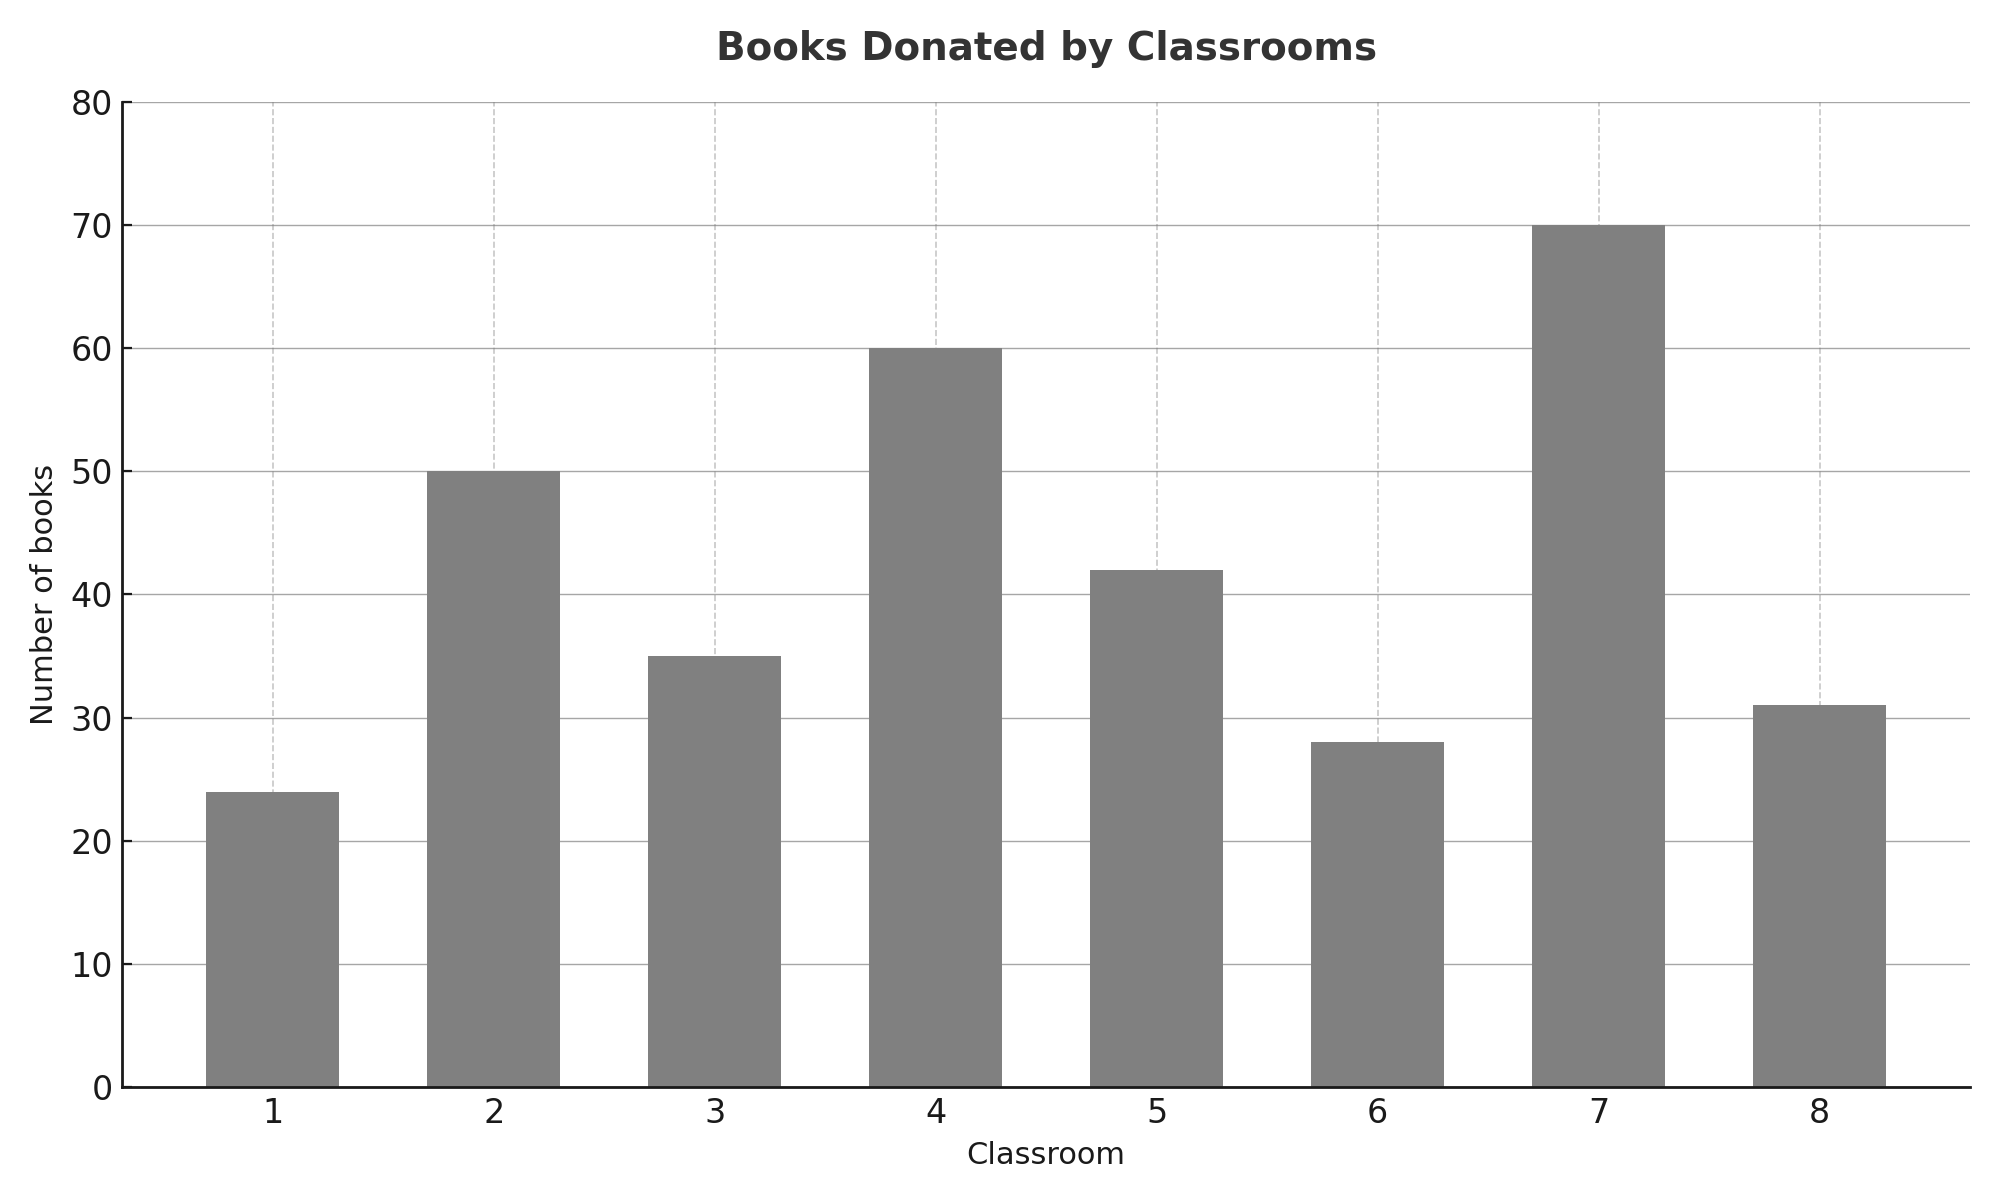
- The bar chart displays the number of books donated by eight classrooms to a library drive.
- Each bar corresponds to a classroom labeled 1 through 8 on the horizontal axis, and the vertical axis shows the number of books.
- How many books did Class 5 donate? Enter your answer as an integer.
1. TRANSLATE the question requirements
- What we need to find: The number of books donated by Class 5
- What we have: A bar chart showing book donations for 8 different classrooms
- What this means: We need to extract the specific data value for Classroom 5 from the visual representation
2. INFER the reading strategy
- To find Class 5's donation, we need to:
- Locate the correct bar (the one labeled "5" on the x-axis)
- Determine the height of that bar
- Read the corresponding value from the y-axis
3. TRANSLATE the visual information to numerical data
- Locate Classroom 5: Find "5" on the horizontal axis (x-axis) - it's the fifth bar from the left
- Find the bar height: Look at where the top of Classroom 5's bar reaches
- Read the y-axis value: The top of the bar aligns with 42 on the vertical axis (y-axis)
Answer: 42
Why Students Usually Falter on This Problem
Most Common Error Path:
Weak TRANSLATE skill - Reading the wrong bar:
Students may count incorrectly from the left or misidentify which bar corresponds to Classroom 5. For example, they might accidentally read the bar for Classroom 4 (which shows 60 books) or Classroom 6 (which shows 28 books).
This leads to selecting an incorrect answer like 60 or 28 instead of the correct value of 42.
Second Most Common Error:
Poor TRANSLATE execution - Misreading the y-axis:
Students may locate the correct bar (Classroom 5) but inaccurately estimate where the top of the bar aligns on the y-axis. They might:
- Round to the nearest major gridline (possibly reading 40 instead of 42)
- Interpolate incorrectly between gridlines
- Not notice the precise alignment point
This may lead them to provide an approximate answer like 40 or 45 instead of the exact value of 42.
The Bottom Line:
This problem requires careful visual reading skills. Success depends on accurately identifying the correct bar and precisely reading its height from the y-axis. The key is to trace directly from the top of Classroom 5's bar to the y-axis, ensuring you're reading the exact alignment point rather than estimating.