A laboratory experiment monitored the temperature of a heated metal object as it cooled in a controlled environment. The graph...
GMAT Algebra : (Alg) Questions
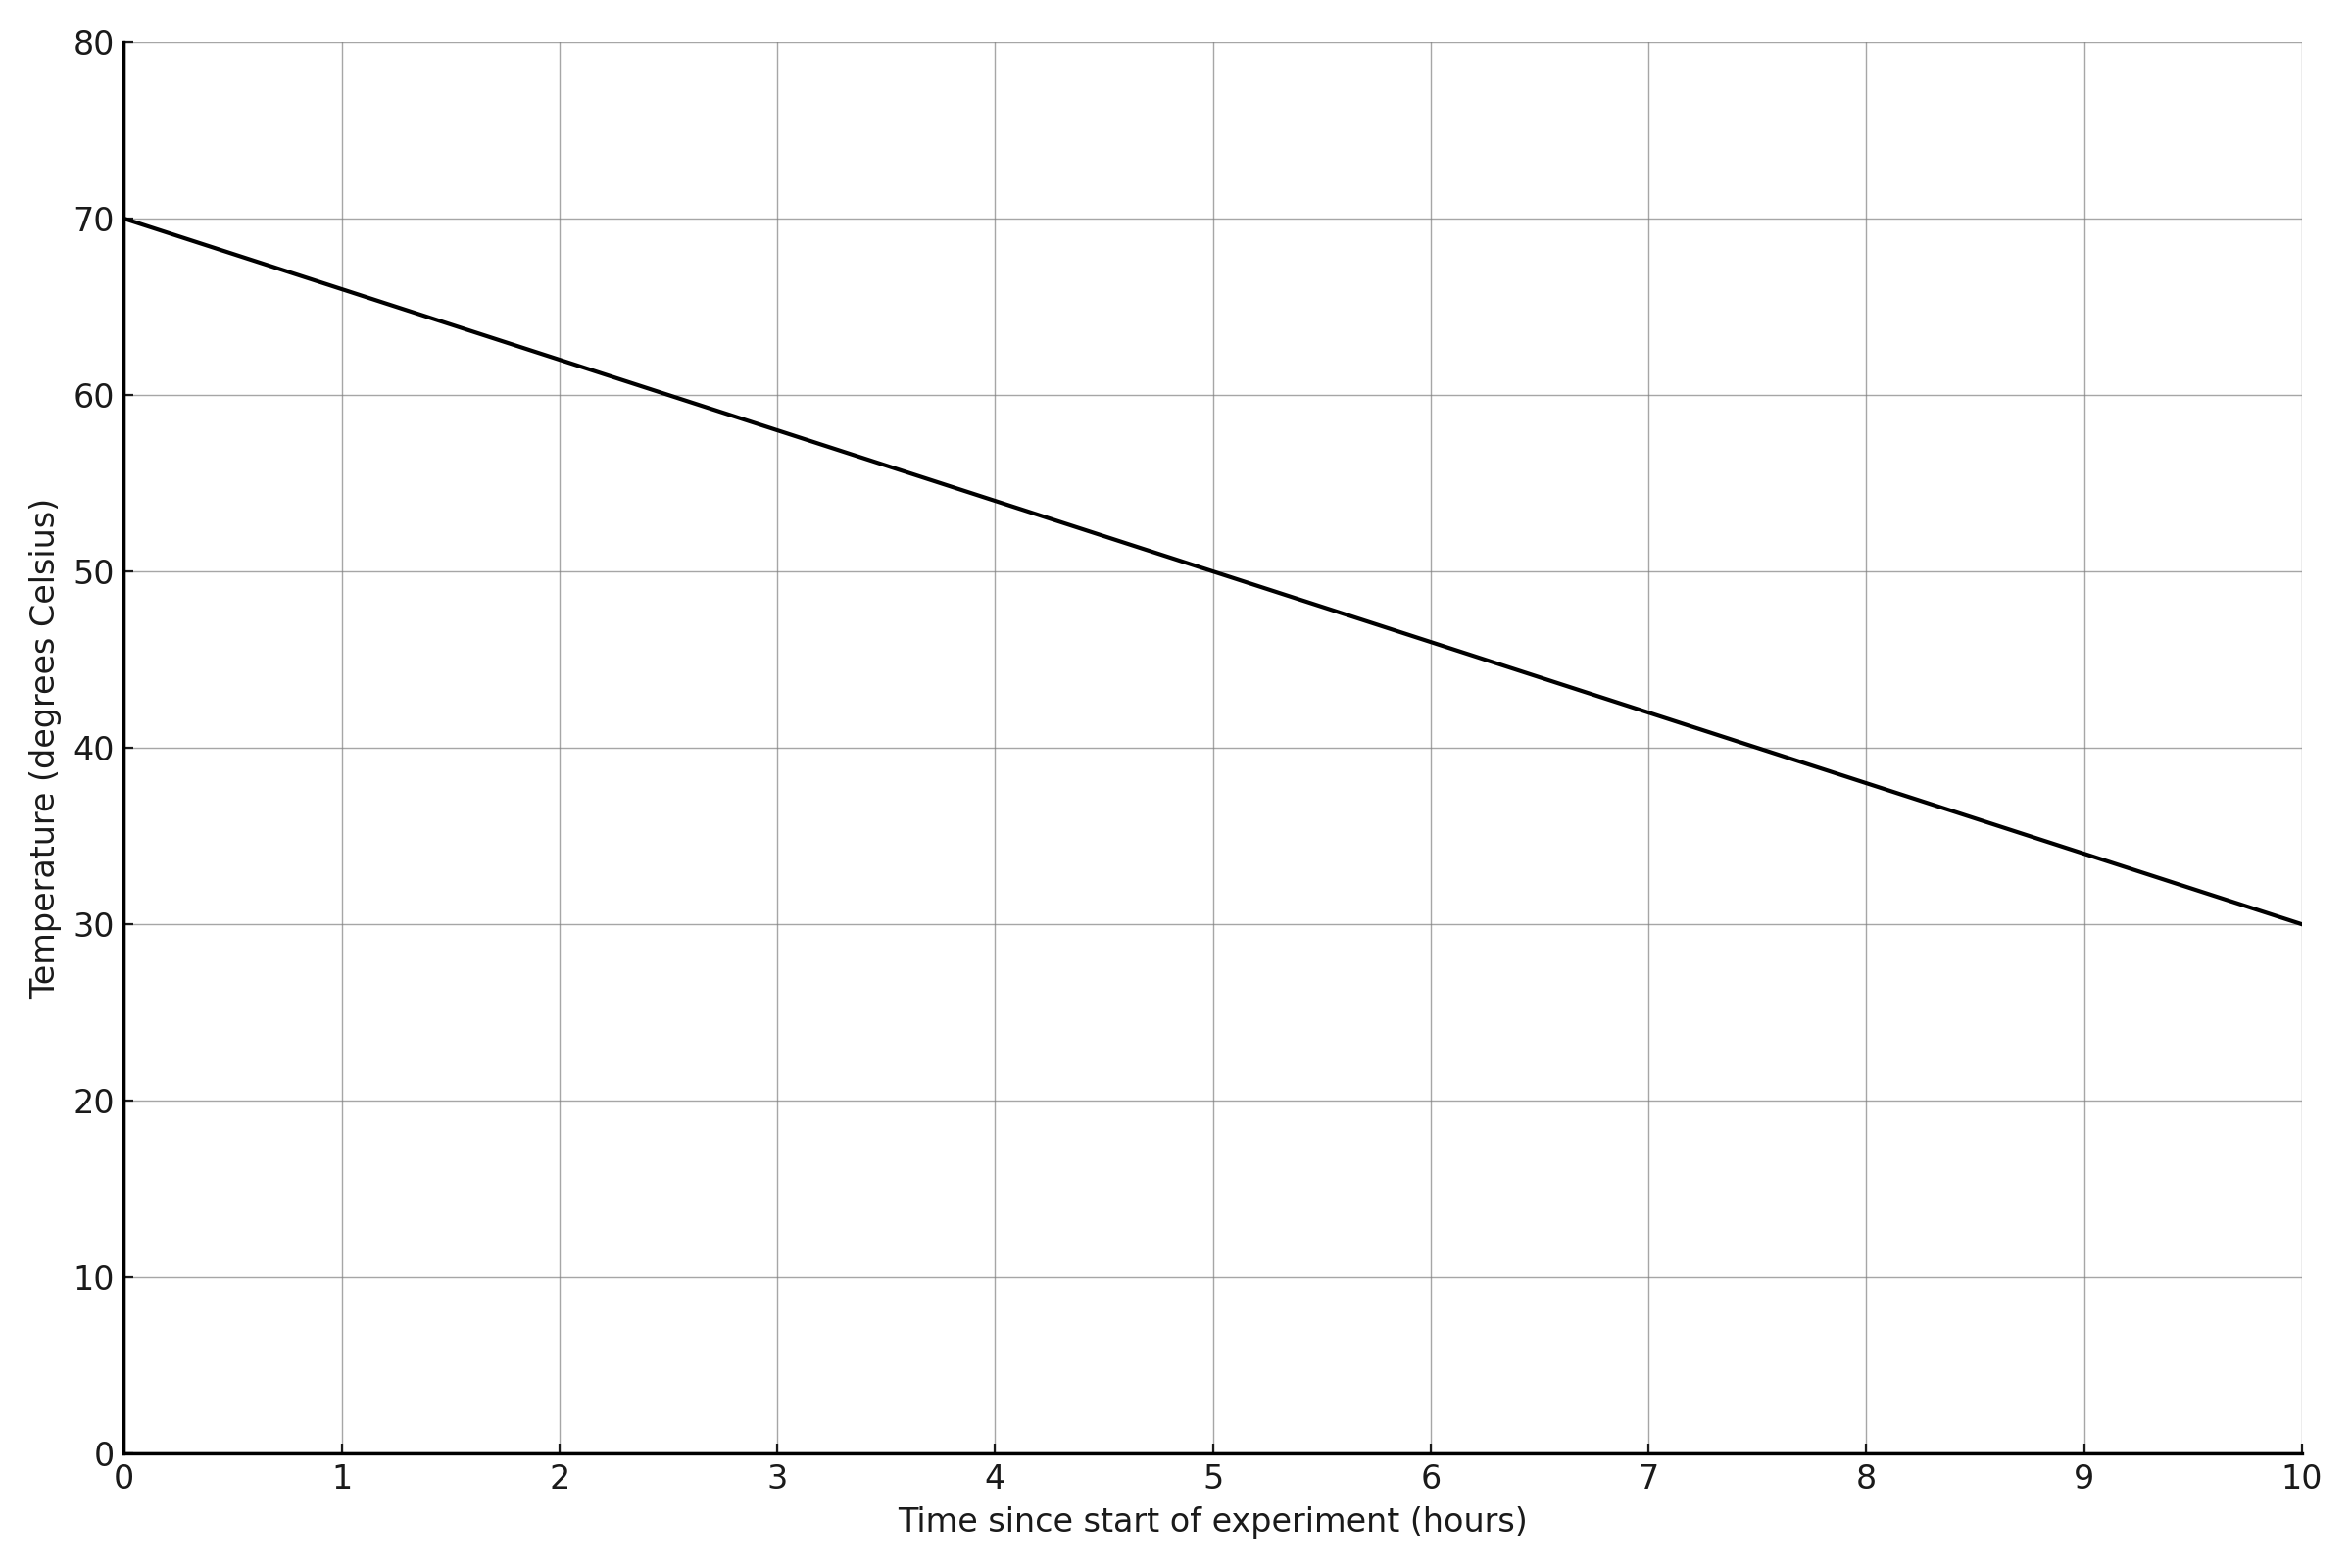
A laboratory experiment monitored the temperature of a heated metal object as it cooled in a controlled environment. The graph of the function g shown, where \(\mathrm{y = g(x)}\), represents the temperature, in degrees Celsius, of the object x hours since the start of the cooling experiment. To the nearest whole degree, what was the initial temperature of the object as estimated by the graph?
1. TRANSLATE the question into mathematical terms
The question asks: "What was the initial temperature of the object?"
- Given information:
- The graph shows temperature (y-axis) vs. time since start of experiment (x-axis)
- We need the temperature at the "initial" moment
- Key translation: "Initial" means "at the beginning" or "at the start of the experiment"
- Since x represents time since the start, the initial moment is when \(\mathrm{x = 0}\)
2. INFER where to find this value on the graph
- In any time-based function, the starting value occurs when time = 0
- On a graph, \(\mathrm{x = 0}\) is located on the y-axis
- This point is called the y-intercept - where the line crosses the y-axis
- Therefore, we need to find the y-coordinate of the y-intercept
3. Read the y-intercept from the graph
- Locate where the line intersects the y-axis (the vertical axis on the left)
- Follow horizontally from that intersection point to read the temperature value
- The line crosses the y-axis at \(\mathrm{y = 70}\)
- Reading carefully: This point is at \(\mathrm{(0, 70)}\)
Answer: 70 degrees Celsius
Why Students Usually Falter on This Problem
Most Common Error Path:
Weak TRANSLATE skill: Not understanding that "initial temperature" means the temperature when \(\mathrm{x = 0}\)
Students might think "initial" means:
- The first labeled point they see on the graph
- Some other special point on the line
- The minimum or maximum temperature
Without translating "initial" to "when time = 0," students may search randomly on the graph for what seems like a starting point, potentially reading the wrong temperature value. This leads to confusion and guessing, possibly selecting a temperature from a different time value visible on the graph (like 30, 50, or 60 degrees).
Second Most Common Error:
Misreading the graph scale: Not carefully counting the gridlines on the y-axis
Students might:
- Miscount the intervals between gridlines
- Estimate incorrectly between marked values
- Read from the wrong gridline
For instance, if they misread the scale, they might think the y-intercept is at 65 or 75 instead of 70. This results in an incorrect numerical answer even though their approach was correct.
The Bottom Line:
This problem tests whether students can connect everyday language ("initial") to mathematical concepts (\(\mathrm{x = 0}\), y-intercept) and then accurately read values from a graph. The key insight is recognizing that in time-based contexts, "initial" always means "when time equals zero."