The figure shows the graph of \(\mathrm{y = g(x)}\), where \(\mathrm{g(x) = Ax^3 + Bx^2 + Cx + D}\) for...
GMAT Advanced Math : (Adv_Math) Questions
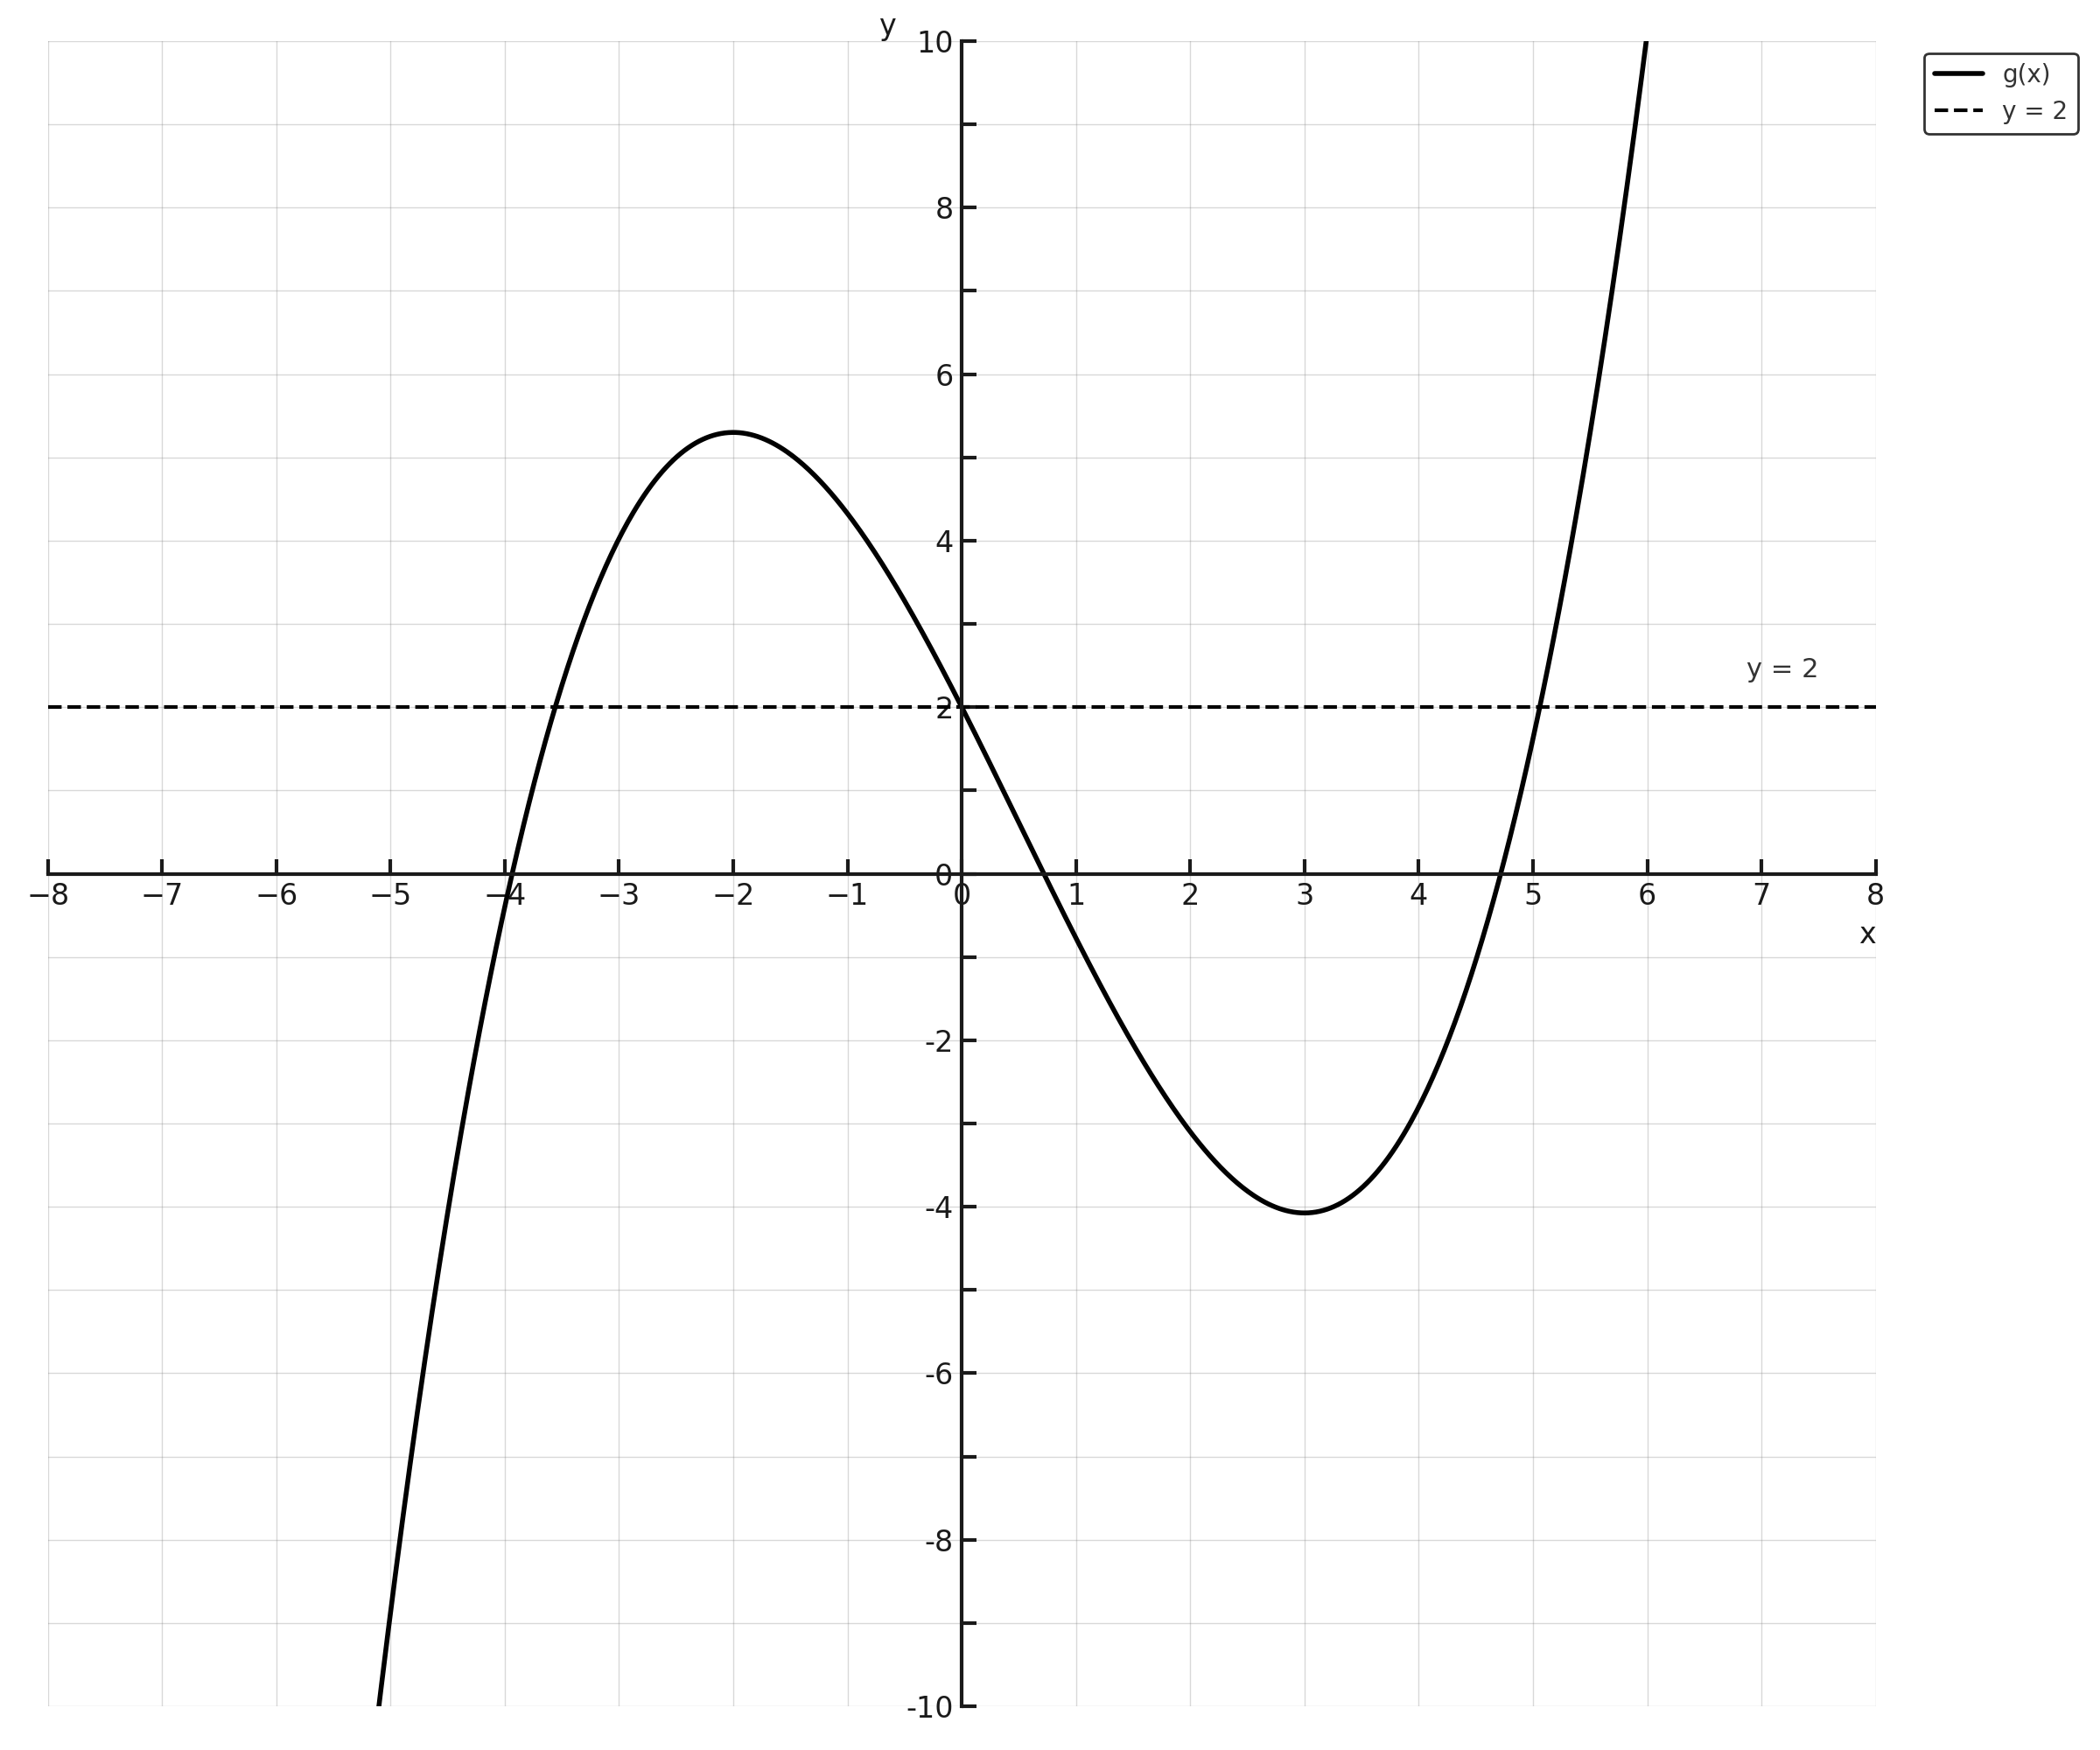
- The figure shows the graph of \(\mathrm{y = g(x)}\), where \(\mathrm{g(x) = Ax^3 + Bx^2 + Cx + D}\) for real constants A, B, C, and D.
- A horizontal dashed line \(\mathrm{y = 2}\) is drawn on the same coordinate plane.
- Based on the graph, for how many real values of x does \(\mathrm{g(x) = 2}\)?
1. INFER what the question is asking
The problem asks for how many real values of x satisfy \(\mathrm{g(x) = 2}\).
- Key insight: This means we need to find all points where the height of the cubic curve equals 2.
- Graphically, this is the same as counting where the curve \(\mathrm{y = g(x)}\) crosses the horizontal line \(\mathrm{y = 2}\).
2. VISUALIZE the relevant features of the graph
- Observe the cubic curve's behavior:
- It has a local maximum (highest point in a region) around \(\mathrm{x = -2, y ≈ 5.3}\)
- It has a local minimum (lowest point in a region) around \(\mathrm{x = 2.5, y ≈ -4}\)
- The curve goes downward on the far left (negative cubic behavior)
- The curve goes upward on the far right (positive leading coefficient)
- Locate the horizontal line \(\mathrm{y = 2}\) (shown as a dashed line)
- Note the position: The local max is ABOVE \(\mathrm{y = 2}\), while the local min is BELOW \(\mathrm{y = 2}\)
3. INFER how many times the curve must cross \(\mathrm{y = 2}\)
Think about the curve's journey from left to right:
- First crossing (left side): The curve starts very low on the left, then rises upward. It must cross \(\mathrm{y = 2}\) on its way up to the local maximum at \(\mathrm{y ≈ 5.3}\)
- Looking at the graph: This occurs around \(\mathrm{x ≈ -3.6}\)
- Second crossing (middle): After reaching the maximum above \(\mathrm{y = 2}\), the curve descends toward the minimum at \(\mathrm{y ≈ -4}\). It must cross \(\mathrm{y = 2}\) again on the way down.
- Looking at the graph: This occurs around \(\mathrm{x ≈ 0.3}\)
- Third crossing (right side): After the minimum below \(\mathrm{y = 2}\), the curve rises again and continues upward. It must cross \(\mathrm{y = 2}\) one more time.
- Looking at the graph: This occurs around \(\mathrm{x ≈ 5.4}\)
4. VISUALIZE and count all intersection points
Carefully examining the graph, count each place where the solid curve crosses the dashed line:
- One crossing on the left side (before the local max)
- One crossing in the middle (between the local max and local min)
- One crossing on the right side (after the local min)
Total: 3 intersection points
Answer: C (Three)
Why Students Usually Falter on This Problem
Most Common Error Path:
Weak VISUALIZE skill: Students may miscount the intersection points, often counting only TWO intersections instead of three.
This typically happens because:
- They clearly see the two middle intersections (around \(\mathrm{x ≈ 0.3}\) and one other), but miss one of the outer intersections
- The leftmost intersection (around \(\mathrm{x ≈ -3.6}\)) occurs where the graph may be harder to read precisely
- They may confuse the turning points (local maximum and minimum) with intersection points
- They may assume that since there are two turning points, there should be two intersections
This may lead them to select Choice B (Two).
Second Most Common Error:
Weak INFER skill: Students may not understand that solving \(\mathrm{g(x) = 2}\) means finding intersections with the line \(\mathrm{y = 2}\).
Instead, they might:
- Try to count turning points (local extrema) instead of intersections
- Count the number of times the curve crosses \(\mathrm{y = 0}\) (the x-axis) instead of \(\mathrm{y = 2}\)
- Not understand what the question is asking graphically
This leads to confusion and guessing among the answer choices.
The Bottom Line:
This problem requires careful visual analysis and systematic counting. The key challenge is making sure you identify ALL three crossing points, especially the ones at the edges of the visible graph. Remember: trace the curve from left to right and count every time it crosses the dashed line \(\mathrm{y = 2}\).