The dot plot above shows the distribution of the 15 values in data set A. The standard deviation of data...
GMAT Problem-Solving and Data Analysis : (PS_DA) Questions
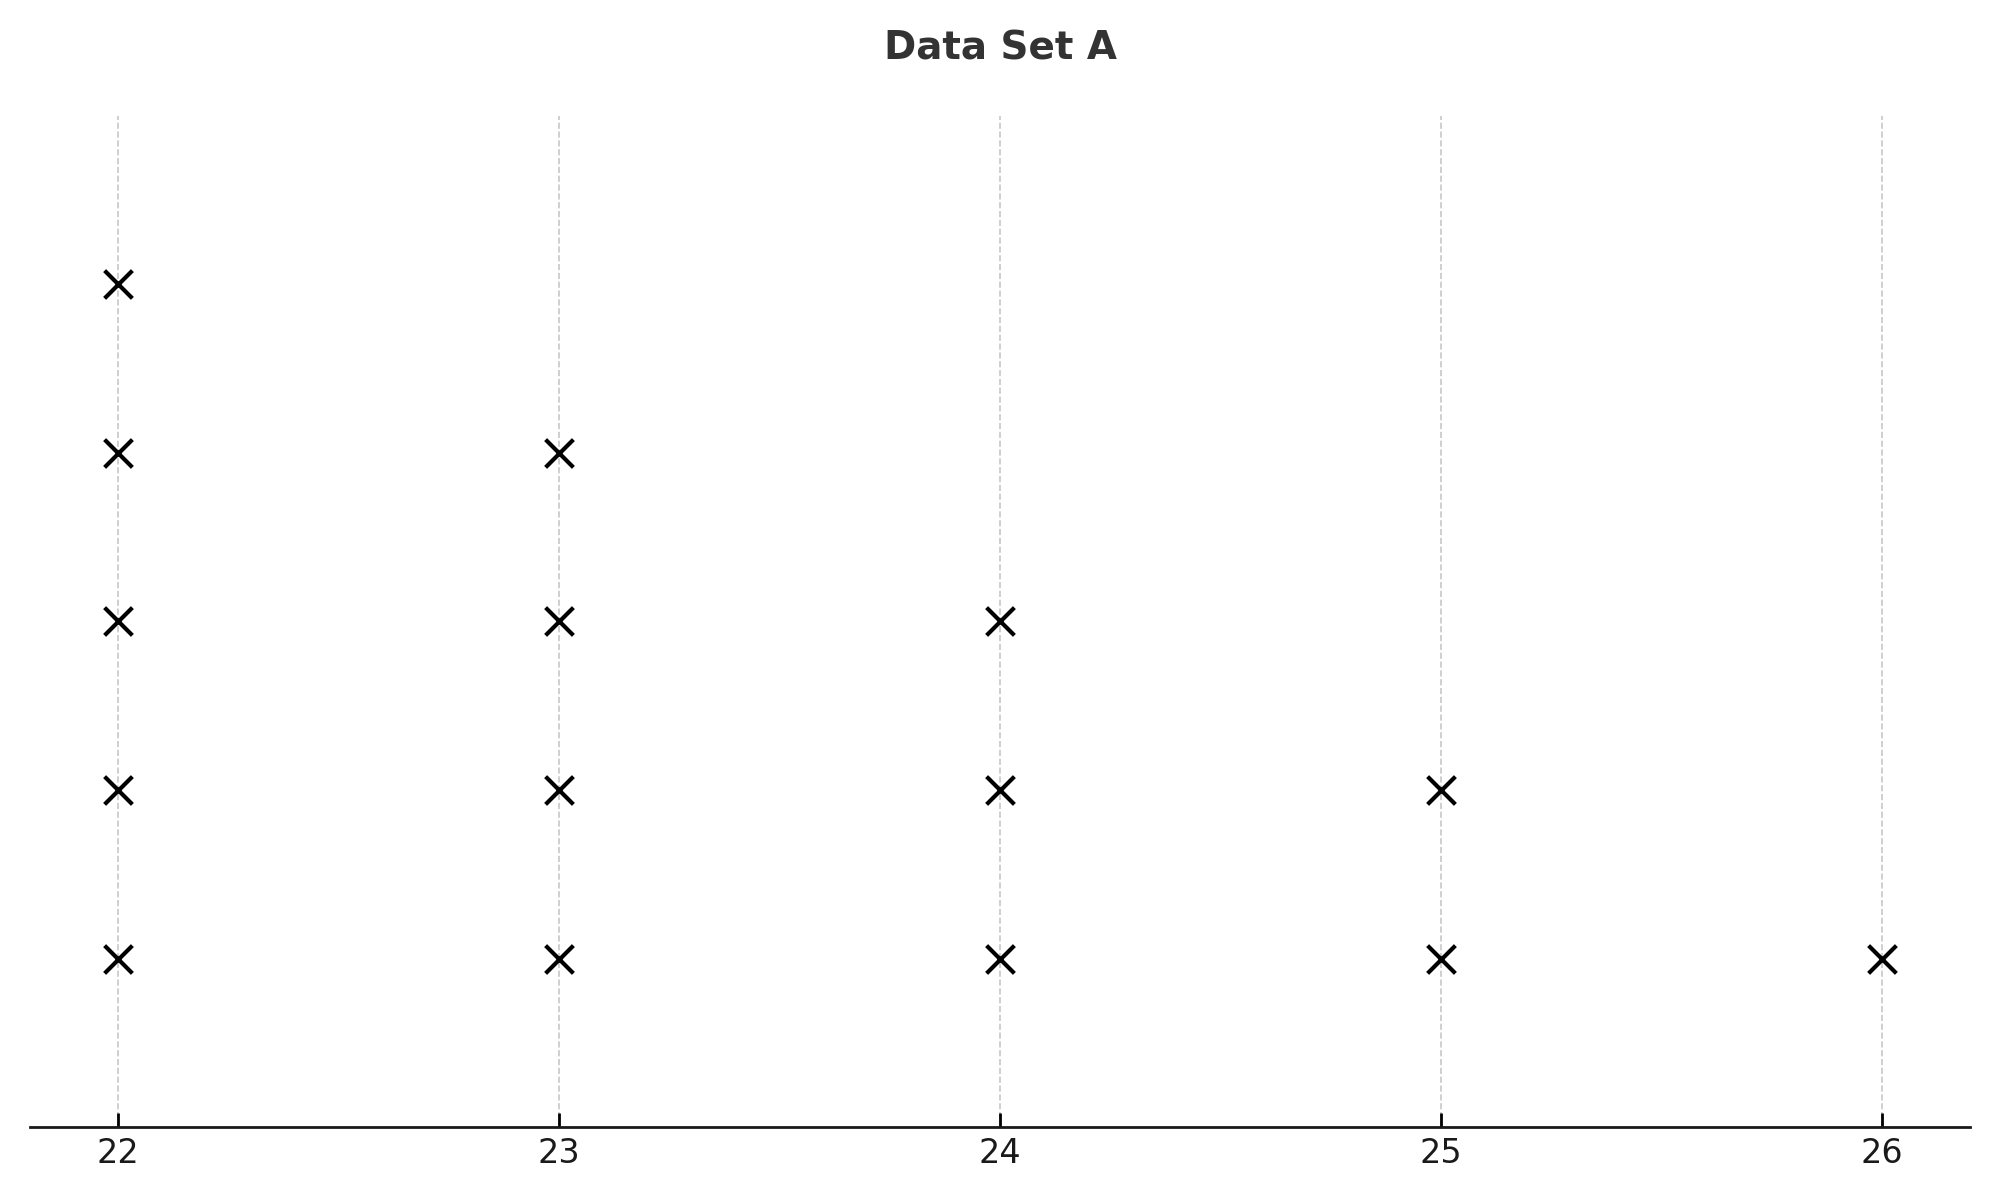
The dot plot above shows the distribution of the 15 values in data set A. The standard deviation of data set A is approximately \(\mathrm{1.249}\). Data set C is created by multiplying each value in data set A by \(\mathrm{2}\). What is the standard deviation of data set C?
1. TRANSLATE the problem information
- Given information:
- Data Set A has 15 values (shown in dot plot)
- Standard deviation of Data Set A \(= 1.249\)
- Data Set C is created by multiplying each value in Data Set A by 2
- What we need to find:
- Standard deviation of Data Set C
2. INFER the most efficient approach
- The key insight: We don't need to manually create all 15 values of Data Set C and recalculate the standard deviation from scratch
- Instead, we can use a transformation property: When you multiply every value in a data set by a constant, the standard deviation transforms in a predictable way
- Strategic decision: Apply the scalar multiplication property of standard deviation
3. INFER the correct transformation rule
- Critical property: When each value in a data set is multiplied by constant k, the standard deviation is also multiplied by |k|
- Formula: \(\mathrm{SD(k × X)} = |k| × \mathrm{SD(X)}\)
- In this problem: \(k = 2\), so \(\mathrm{SD(C)} = 2 × \mathrm{SD(A)}\)
4. SIMPLIFY to find the answer
- \(\mathrm{SD(C)} = 2 × \mathrm{SD(A)}\)
- \(\mathrm{SD(C)} = 2 × 1.249\)
- \(\mathrm{SD(C)} = 2.498\)
Answer: 2.498
Why Students Usually Falter on This Problem
Most Common Error Path:
Weak INFER skill/Conceptual confusion: Students confuse the transformation rule for standard deviation with the transformation rule for variance.
Since variance is the square of standard deviation, when you multiply a data set by k, the variance gets multiplied by k². Students might incorrectly apply this squared relationship to standard deviation itself:
- Incorrect reasoning: "If I multiply all values by 2, the standard deviation gets multiplied by \(2^2 = 4\)"
- Incorrect calculation: \(\mathrm{SD(C)} = 4 × 1.249 = 4.996\)
This leads to an answer of 4.996 (or approximately 5) instead of the correct 2.498.
Second Most Common Error:
Missing conceptual knowledge/Weak INFER skill: Students don't know the transformation property at all and think they need to recreate Data Set C and calculate from scratch, but make errors in the complex calculation process.
Without recognizing the shortcut property:
- They might try to identify all 15 values from the dot plot
- Multiply each by 2 to get Data Set C
- Attempt to calculate standard deviation using the formula with mean, squared deviations, etc.
- Make arithmetic errors in this lengthy process
This leads to confusion and potentially abandoning the systematic solution, resulting in guessing.
The Bottom Line:
This problem tests whether students understand how statistical measures transform under linear operations. The trap is that while the calculation appears simple once you know the property, students must distinguish between how standard deviation scales (linearly with k) versus how variance scales (with k²). The dot plot is essentially a red herring—it provides context and verifies reasonableness, but the mathematical solution relies entirely on understanding transformation properties.