The dot plot represents a data set of the number of bursts for 13 eruptions of a steam vent. If...
GMAT Problem-Solving and Data Analysis : (PS_DA) Questions
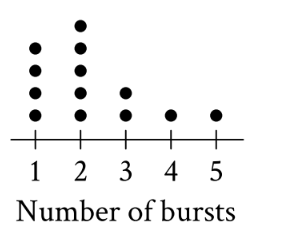
The dot plot represents a data set of the number of bursts for 13 eruptions of a steam vent. If an additional eruption with 11 bursts is added to this data set to create a new data set of 14 eruptions, which of the following measures will be greater for the new data set than for the original data set?
- The median number of bursts
- The mean number of bursts
I and II
I only
II only
Neither I nor II
1. TRANSLATE the dot plot information
First, count the dots at each value:
- 1 burst: 4 dots
- 2 bursts: 5 dots
- 3 bursts: 2 dots
- 4 bursts: 1 dot
- 5 bursts: 1 dot
Total eruptions: \(4 + 5 + 2 + 1 + 1 = 13\) ✓
2. INFER what calculations are needed
The problem asks which measures will be greater for the new data set, so we need to:
- Calculate the original median and mean
- Calculate the new median and mean (with 11 added)
- Compare each measure
Let's start with median since it only depends on position, not all values.
3. APPLY the median definition to the original data
For 13 values, the median is the 7th value when ordered.
Write out the ordered data (or count positions):
- Positions 1-4: value = 1
- Positions 5-9: value = 2 ← Position 7 is here!
- Positions 10-11: value = 3
- Position 12: value = 4
- Position 13: value = 5
Original median = 2
4. APPLY the median definition to the new data
Adding 11 bursts gives us 14 values total.
For 14 values (even number), the median is the average of the 7th and 8th values.
New ordered data includes the same first 13 values plus 11 at the end:
- Position 7: value = 2
- Position 8: value = 2
New median = \((2 + 2)/2 = 2\)
The median stays at 2, so Statement I is FALSE.
5. SIMPLIFY to find the original mean
Mean = (sum of all values) ÷ (number of values)
Using frequencies to calculate the sum:
\(\mathrm{Sum} = 1(4) + 2(5) + 3(2) + 4(1) + 5(1)\)
\(\mathrm{Sum} = 4 + 10 + 6 + 4 + 5 = 29\)
Original mean = \(29/13\)
6. SIMPLIFY to find the new mean
Adding 11 to our data:
\(\mathrm{New\, sum} = 29 + 11 = 40\)
New count = 14
New mean = \(40/14 = 20/7\)
7. INFER how to compare the means and SIMPLIFY the comparison
We need to determine if \(40/14 \gt 29/13\).
Method 1: Cross-multiply
- \(29 \times 14 = 406\)
- \(40 \times 13 = 520\)
- Since \(520 \gt 406\), we have \(40/14 \gt 29/13\) ✓
Method 2: Convert to decimals
- \(29/13 \approx 2.23\)
- \(40/14 \approx 2.86\)
- Clearly \(2.86 \gt 2.23\) ✓
The mean increases, so Statement II is TRUE.
Answer: C (II only)
Why Students Usually Falter on This Problem
Most Common Error Path:
TRANSLATE error - Misreading the dot plot: Students may miscount the dots, especially the column with 5 dots at value 2. If they count only 4 dots at 2 instead of 5, they calculate:
- Wrong sum = \(1(4) + 2(4) + 3(2) + 4(1) + 5(1) = 27\)
- Wrong original mean = \(27/13\)
- Wrong new mean = \(38/14\)
This changes the comparison and may lead them to select Choice D (Neither I nor II) since their calculated means might appear nearly equal or in the wrong order.
Second Most Common Error:
Conceptual gap - Median for even numbers: Students might forget that when there's an even number of data points, they must average the two middle values. They might incorrectly:
- Just take the 7th value (which is 2), thinking the median changes
- Take the 8th value instead
- Get confused about which positions to use
However, since positions 7 and 8 are both 2 in this problem, this error doesn't change the answer—students get lucky! But this reveals a conceptual weakness that would hurt them on other problems.
Third Most Common Error:
SIMPLIFY error - Incorrect fraction comparison: Students might struggle comparing \(29/13\) and \(40/14\), especially without a calculator. They might:
- Incorrectly simplify \(40/14\) to \(20/14\) instead of \(20/7\), causing confusion
- Compare numerators only (\(40 \gt 29\)) without considering denominators properly
- Make arithmetic errors when cross-multiplying
This could lead to concluding the mean doesn't increase, causing them to select Choice D (Neither I nor II) or Choice B (I only) if they also made errors with the median.
The Bottom Line:
This problem tests whether students truly understand the difference between median (position-based, resistant to outliers) and mean (value-based, sensitive to outliers). Adding an extreme value like 11 to a data set clustered around 1-5 dramatically increases the mean but doesn't shift the median at all. Students must carefully translate visual data and systematically calculate both measures for both data sets.
I and II
I only
II only
Neither I nor II