The dot plots above show the score distributions for 30 students who took two different forms of a mathematics test....
GMAT Problem-Solving and Data Analysis : (PS_DA) Questions
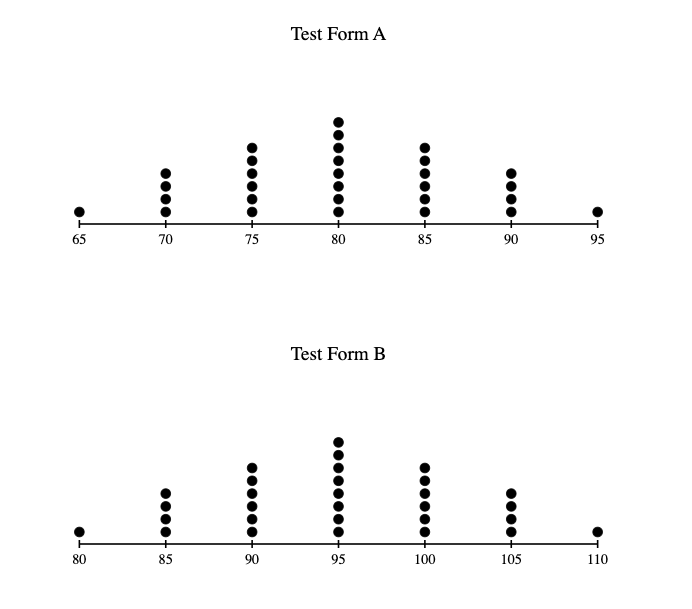
The dot plots above show the score distributions for 30 students who took two different forms of a mathematics test. Test Form B was created by adding exactly 15 points to every corresponding score from Test Form A. Which statement best compares the standard deviations of the scores for these two test forms?
The standard deviation of Test Form A scores is less than the standard deviation of Test Form B scores.
The standard deviation of Test Form A scores is equal to the standard deviation of Test Form B scores.
The standard deviation of Test Form A scores is greater than the standard deviation of Test Form B scores.
There is not enough information to determine the relationship between these standard deviations.
1. TRANSLATE the problem information
- Given information:
- Test Form A: 30 students' scores shown in the first dot plot
- Test Form B: Created by adding exactly 15 points to every single Form A score
- Question asks: How do the standard deviations compare?
- What "adding exactly 15 points to every score" means:
- If a student scored 70 on Form A, they would score 85 on Form B
- If a student scored 80 on Form A, they would score 95 on Form B
- Every single score increases by the same amount: 15 points
2. INFER what standard deviation measures
- Standard deviation measures spread - how far data values are from the mean
- It does NOT measure the actual values themselves
- Think of it this way: Standard deviation tells us how "bunched up" or "spread out" the scores are
3. INFER the effect of adding a constant
- When we add 15 to every score:
- The mean shifts up by 15 (if the average was 78, it becomes 93)
- But what about the distances between scores?
- Here's the key insight: The distances stay the same!
- If two students scored 70 and 80 on Form A (10 points apart)
- They score 85 and 95 on Form B (still 10 points apart)
- Every score shifts by 15, so relative distances are preserved
- Since standard deviation measures these distances from the mean, and all distances stay the same, the standard deviation doesn't change
4. VISUALIZE by comparing the dot plots
- Look at both dot plots:
- Form A: Dots clustered around 75-85
- Form B: Dots clustered around 90-100 (exactly 15 points higher)
- Notice the shapes are identical:
- Both have the same pattern of distribution
- Form B is just Form A shifted 15 points to the right
- The spread in both plots looks exactly the same
5. Select the answer
- Standard deviation of Form A = Standard deviation of Form B
Answer: B
Why Students Usually Falter on This Problem
Most Common Error Path:
Weak INFER skill: Confusing measures of center with measures of spread
Many students see that the scores are higher in Form B and intuitively think "everything increased, so the standard deviation must be larger too." They confuse what's happening to the mean (which does increase by 15) with what's happening to the standard deviation (which stays the same).
This misconception treats standard deviation like it measures "how big the numbers are" rather than "how spread out the numbers are." Since Form B has bigger numbers, students incorrectly conclude it must have a bigger standard deviation.
This may lead them to select Choice A (standard deviation of Form A < standard deviation of Form B).
Second Most Common Error:
Weak INFER skill: Overthinking and doubting the relationship
Some students recognize that adding a constant shouldn't change spread, but then second-guess themselves. They might think "the problem seems too straightforward" or "there must be a trick" and convince themselves they need more information or complex calculations to determine the relationship.
This causes them to get stuck and potentially select Choice D (not enough information).
The Bottom Line:
This problem tests whether students truly understand what standard deviation measures. It's not about the size of the numbers - it's about how far apart they are from each other. When all values shift by the same amount (adding 15 to everything), the distances between values don't change, so the spread doesn't change, so standard deviation stays the same. The visual confirmation in the dot plots - identical shapes, just shifted - should reinforce this concept.
The standard deviation of Test Form A scores is less than the standard deviation of Test Form B scores.
The standard deviation of Test Form A scores is equal to the standard deviation of Test Form B scores.
The standard deviation of Test Form A scores is greater than the standard deviation of Test Form B scores.
There is not enough information to determine the relationship between these standard deviations.