The dot plots represent the distributions of values in data sets A and B.Which of the following statements must be...
GMAT Problem-Solving and Data Analysis : (PS_DA) Questions
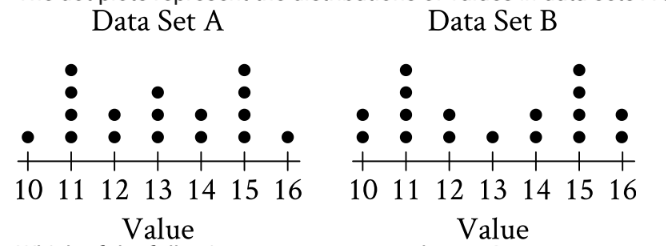
The dot plots represent the distributions of values in data sets A and B.
Which of the following statements must be true?
- The median of data set A is equal to the median of data set B.
- The standard deviation of data set A is equal to the standard deviation of data set B.
I only
II only
I and II
Neither I nor II
1. TRANSLATE the dot plot information into frequency data
Count the dots carefully for each value:
Data Set A:
- 10: 1 dot
- 11: 4 dots
- 12: 2 dots
- 13: 3 dots
- 14: 2 dots
- 15: 4 dots
- 16: 1 dot
- Total: 17 values
Data Set B:
- 10: 2 dots
- 11: 4 dots
- 12: 2 dots
- 13: 1 dot
- 14: 2 dots
- 15: 4 dots
- 16: 2 dots
- Total: 17 values
2. INFER the strategy for finding the median
Since both data sets have 17 values (an odd number), the median will be the middle value—the 9th value when all values are arranged in order.
3. Find the median of Data Set A
Write out the values in order:
10, 11, 11, 11, 11, 12, 12, 13, 13, 13, 14, 14, 15, 15, 15, 15, 16
Count to the 9th position: Median = 13
4. Find the median of Data Set B
Write out the values in order:
10, 10, 11, 11, 11, 11, 12, 12, 13, 14, 14, 15, 15, 15, 15, 16, 16
Count to the 9th position: Median = 13
5. Evaluate Statement I
Both medians equal 13, so Statement I is TRUE.
6. INFER how to compare standard deviations without calculation
Standard deviation measures spread. We need to compare how the values are distributed around the mean.
Since both distributions are symmetric, the mean equals the median for each, so both means = 13.
7. Compare the distribution of values around the mean
Let's count how many values are at each distance from 13:
Data Set A:
- Distance 0 (value 13): 3 values
- Distance 1 (values 12, 14): 2 + 2 = 4 values
- Distance 2 (values 11, 15): 4 + 4 = 8 values
- Distance 3 (values 10, 16): 1 + 1 = 2 values
Data Set B:
- Distance 0 (value 13): 1 value
- Distance 1 (values 12, 14): 2 + 2 = 4 values
- Distance 2 (values 11, 15): 4 + 4 = 8 values
- Distance 3 (values 10, 16): 2 + 2 = 4 values
8. INFER which data set has larger standard deviation
Data Set B has:
- MORE values at distance 3 from the mean (4 vs. 2)
- FEWER values at distance 0 from the mean (1 vs. 3)
This means Data Set B is more spread out, so it has a larger standard deviation than Data Set A.
9. Evaluate Statement II
The standard deviations are NOT equal, so Statement II is FALSE.
10. Select the correct answer
Only Statement I is true.
Answer: A (I only)
Why Students Usually Falter on This Problem
Most Common Error Path:
Weak INFER skill: Assuming symmetric distributions always have equal standard deviations
Students may notice that both distributions are symmetric around the same center (13) and incorrectly conclude that this means they must have equal standard deviations. They fail to recognize that standard deviation depends not just on symmetry, but on HOW the values are distributed at different distances from the center.
Without comparing the actual distribution of values at each distance from the mean, they might think both statements are true.
This may lead them to select Choice C (I and II).
Second Most Common Error:
Weak TRANSLATE skill: Miscounting dots in the dot plots
Students might miscount the stacked dots, especially where there are 3 or 4 dots at a single value. For example:
- Missing that there are 3 dots at value 13 in Data Set A
- Miscounting the 4 dots at value 11
This leads to incorrect frequency data, which then gives wrong medians.
This causes them to get stuck with conflicting results and may lead to guessing.
The Bottom Line:
This problem requires careful attention to detail when reading dot plots AND conceptual understanding that standard deviation measures spread—two distributions can be symmetric around the same center but have different amounts of spread, resulting in different standard deviations.
I only
II only
I and II
Neither I nor II