Each of the dot plots shown represents the number of glue sticks brought in by each student for two classes,...
GMAT Problem-Solving and Data Analysis : (PS_DA) Questions
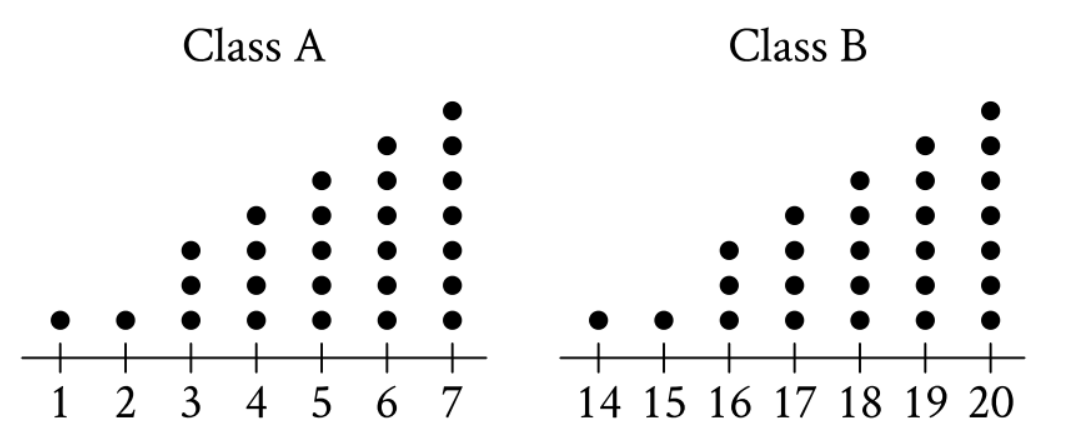
Each of the dot plots shown represents the number of glue sticks brought in by each student for two classes, class A and class B. Which statement best compares the standard deviations of the numbers of glue sticks brought in by each student for these two classes?
Choose 1 answer:
The standard deviation of the number of glue sticks brought in by each student for class A is less than the standard deviation of the number of glue sticks brought in by each student for class B.
The standard deviation of the number of glue sticks brought in by each student for class A is equal to the standard deviation of the number of glue sticks brought in by each student for class B.
The standard deviation of the number of glue sticks brought in by each student for class A is greater than the standard deviation of the number of glue sticks brought in by each student for class B.
There is not enough information to compare these standard deviations.
1. TRANSLATE the dot plots into frequency distributions
- Given information from Class A:
- 1 glue stick: 1 student (1 dot)
- 2 glue sticks: 1 student (1 dot)
- 3 glue sticks: 3 students (3 dots)
- 4 glue sticks: 4 students (4 dots)
- 5 glue sticks: 5 students (5 dots)
- 6 glue sticks: 6 students (6 dots)
- 7 glue sticks: 7 students (7 dots)
- Given information from Class B:
- 14 glue sticks: 1 student (1 dot)
- 15 glue sticks: 1 student (1 dot)
- 16 glue sticks: 3 students (3 dots)
- 17 glue sticks: 4 students (4 dots)
- 18 glue sticks: 5 students (5 dots)
- 19 glue sticks: 6 students (6 dots)
- 20 glue sticks: 7 students (7 dots)
2. INFER the relationship between the two distributions
- Look at the frequency patterns:
- Class A frequencies: 1, 1, 3, 4, 5, 6, 7
- Class B frequencies: 1, 1, 3, 4, 5, 6, 7
- They're identical!
- Notice that Class B values are consistently 13 units higher than Class A values:
- \(14 - 1 = 13\)
- \(15 - 2 = 13\)
- \(16 - 3 = 13\)
- (and so on...)
- This means Class B's distribution is simply Class A's distribution shifted to the right by 13 units.
3. INFER how this affects standard deviation
- Recall what standard deviation measures: the spread or variability of data around the mean.
- Key insight: When you shift all data values by the same constant amount, you're moving the entire distribution without changing its shape or spread.
- Think of it this way: If everyone in Class B brought 13 more glue sticks than everyone in Class A (maintaining the same pattern), the variability within each class stays the same—the differences between students within each class are unchanged.
- Therefore: Shifting data by a constant changes the mean (location) but does NOT change the standard deviation (spread).
4. INFER the comparison result
- Since both distributions have:
- The same frequency pattern
- The same shape
- The same relative spread
- The standard deviations must be equal.
Answer: B. The standard deviation of the number of glue sticks brought in by each student for class A is equal to the standard deviation of the number of glue sticks brought in by each student for class B.
Why Students Usually Falter on This Problem
Most Common Error Path:
Weak INFER skill—Confusing magnitude with variability: Students see that Class B has much larger values (14-20) compared to Class A (1-7) and incorrectly assume this means Class B must have a larger standard deviation.
This misconception treats standard deviation as if it measures the size of the values rather than their spread around the mean. Students think: "20 is much bigger than 7, so Class B must vary more."
This may lead them to select Choice C (Class A standard deviation is greater than Class B) or get the direction backwards.
Second Most Common Error:
Inadequate TRANSLATE execution—Miscounting dots: Students miscount the vertical dots in one or both plots, leading to incorrect frequency distributions. For example, seeing 6 dots instead of 7 at value 7, or 4 dots instead of 5 at value 18.
With incorrect data, any subsequent analysis—even if conceptually sound—leads to wrong conclusions about whether the distributions match.
This causes confusion and may lead to guessing or incorrectly selecting Choice A or C based on flawed comparisons.
The Bottom Line:
This problem tests whether students understand standard deviation as a measure of spread (not size) and whether they recognize that shifting data preserves spread. The visual similarity of the dot plots is actually a major hint—if students can step back and see the identical shapes, they can avoid calculation entirely and reason their way to the correct answer.
The standard deviation of the number of glue sticks brought in by each student for class A is less than the standard deviation of the number of glue sticks brought in by each student for class B.
The standard deviation of the number of glue sticks brought in by each student for class A is equal to the standard deviation of the number of glue sticks brought in by each student for class B.
The standard deviation of the number of glue sticks brought in by each student for class A is greater than the standard deviation of the number of glue sticks brought in by each student for class B.
There is not enough information to compare these standard deviations.