In an experiment, a heated cup of coffee is removed from a heat source, and the cup of coffee is...
GMAT Problem-Solving and Data Analysis : (PS_DA) Questions
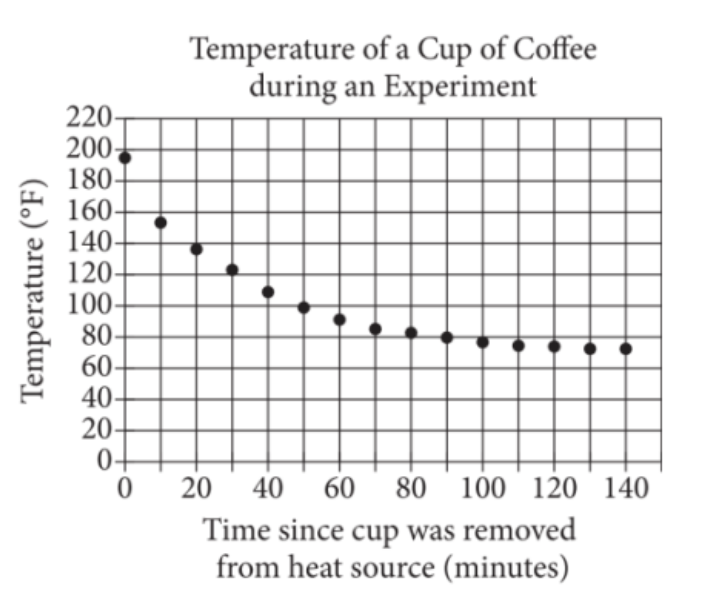
In an experiment, a heated cup of coffee is removed from a heat source, and the cup of coffee is then left in a room that is kept at a constant temperature. The graph above shows the temperature, in degrees Fahrenheit (°F), of the coffee immediately after being removed from the heat source and at 10-minute intervals thereafter. During which of the following 10-minute intervals does the temperature of the coffee decrease at the greatest average rate?
Between 0 and 10 minutes
Between 30 and 40 minutes
Between 50 and 60 minutes
Between 90 and 100 minutes
1. TRANSLATE the question into mathematical terms
The question asks: "During which interval does the temperature decrease at the greatest average rate?"
- TRANSLATE this to mean: Which 10-minute interval shows the biggest temperature drop?
- Why? Because \(\mathrm{average\ rate = \frac{change\ in\ temperature}{change\ in\ time}}\)
2. INFER a key shortcut
Here's the strategic insight that makes this problem easier:
- All four answer choices cover exactly 10 minutes
- Since we're dividing each temperature change by the same number (10 minutes), we can skip the division
- The interval with the greatest temperature drop automatically has the greatest average rate
This means we just need to compare temperature differences, not calculate actual rates!
3. VISUALIZE by reading values from the graph
For each answer choice, carefully locate the two points on the graph and read their temperatures:
Choice A: 0 to 10 minutes
- At 0 min: 200°F
- At 10 min: 150°F
- Temperature drop: \(\mathrm{200 - 150 = 50°F}\)
Choice B: 30 to 40 minutes
- At 30 min: 120°F
- At 40 min: 110°F
- Temperature drop: \(\mathrm{120 - 110 = 10°F}\)
Choice C: 50 to 60 minutes
- At 50 min: 100°F
- At 60 min: 90°F
- Temperature drop: \(\mathrm{100 - 90 = 10°F}\)
Choice D: 90 to 100 minutes
- At 90 min: 80°F
- At 100 min: 77°F
- Temperature drop: \(\mathrm{80 - 77 = 3°F}\)
4. Compare the temperature drops
Looking at our results:
- Choice A: 50°F drop ← This is the largest!
- Choice B: 10°F drop
- Choice C: 10°F drop
- Choice D: 3°F drop
Answer: A (Between 0 and 10 minutes)
Why Students Usually Falter on This Problem
Most Common Error Path:
Weak VISUALIZE skill: Misreading temperature values from the graph
Students sometimes struggle to read exact values from graphs, especially when:
- The gridlines don't align perfectly with data points
- They rush and estimate values incorrectly
- They confuse which axis represents which variable
For example, if a student misreads the temperature at 10 minutes as 160°F instead of 150°F, they would calculate the drop as \(\mathrm{200 - 160 = 40°F}\) for interval A, which is still the largest but would create doubt if they also misread other values.
More critically, if they misread the initial temperature at 0 minutes as 180°F, they might calculate \(\mathrm{180 - 150 = 30°F}\) for Choice A and incorrectly conclude another interval has a greater drop. This leads to confusion and potentially selecting an incorrect answer.
Second Most Common Error:
Missing INFER step: Calculating rates unnecessarily and making arithmetic mistakes
Some students don't realize the shortcut that equal time intervals means they can just compare temperature drops. Instead, they calculate:
- Choice A: \(\mathrm{50°F \div 10\ min = 5°F/min}\)
- Choice B: \(\mathrm{10°F \div 10\ min = 1°F/min}\)
- And so on...
While this approach should work, it introduces unnecessary calculation steps where students might make arithmetic errors (especially with Choice D: \(\mathrm{3°F \div 10\ min = 0.3°F/min}\)). The extra work increases cognitive load and creates more opportunities for mistakes, potentially leading to selecting Choice B, C, or D due to computational errors rather than conceptual misunderstanding.
The Bottom Line:
This problem tests whether students can connect the abstract concept of "average rate of change" to the concrete task of comparing temperature differences on a graph. The key insight is recognizing that equal time intervals allow for a simpler comparison strategy. Students who get stuck on calculating actual rates or who misread graph values are most likely to struggle.
Between 0 and 10 minutes
Between 30 and 40 minutes
Between 50 and 60 minutes
Between 90 and 100 minutes