The graph shows the modeled number y of customers in a help-desk queue x hours after the center opens, for...
GMAT Advanced Math : (Adv_Math) Questions
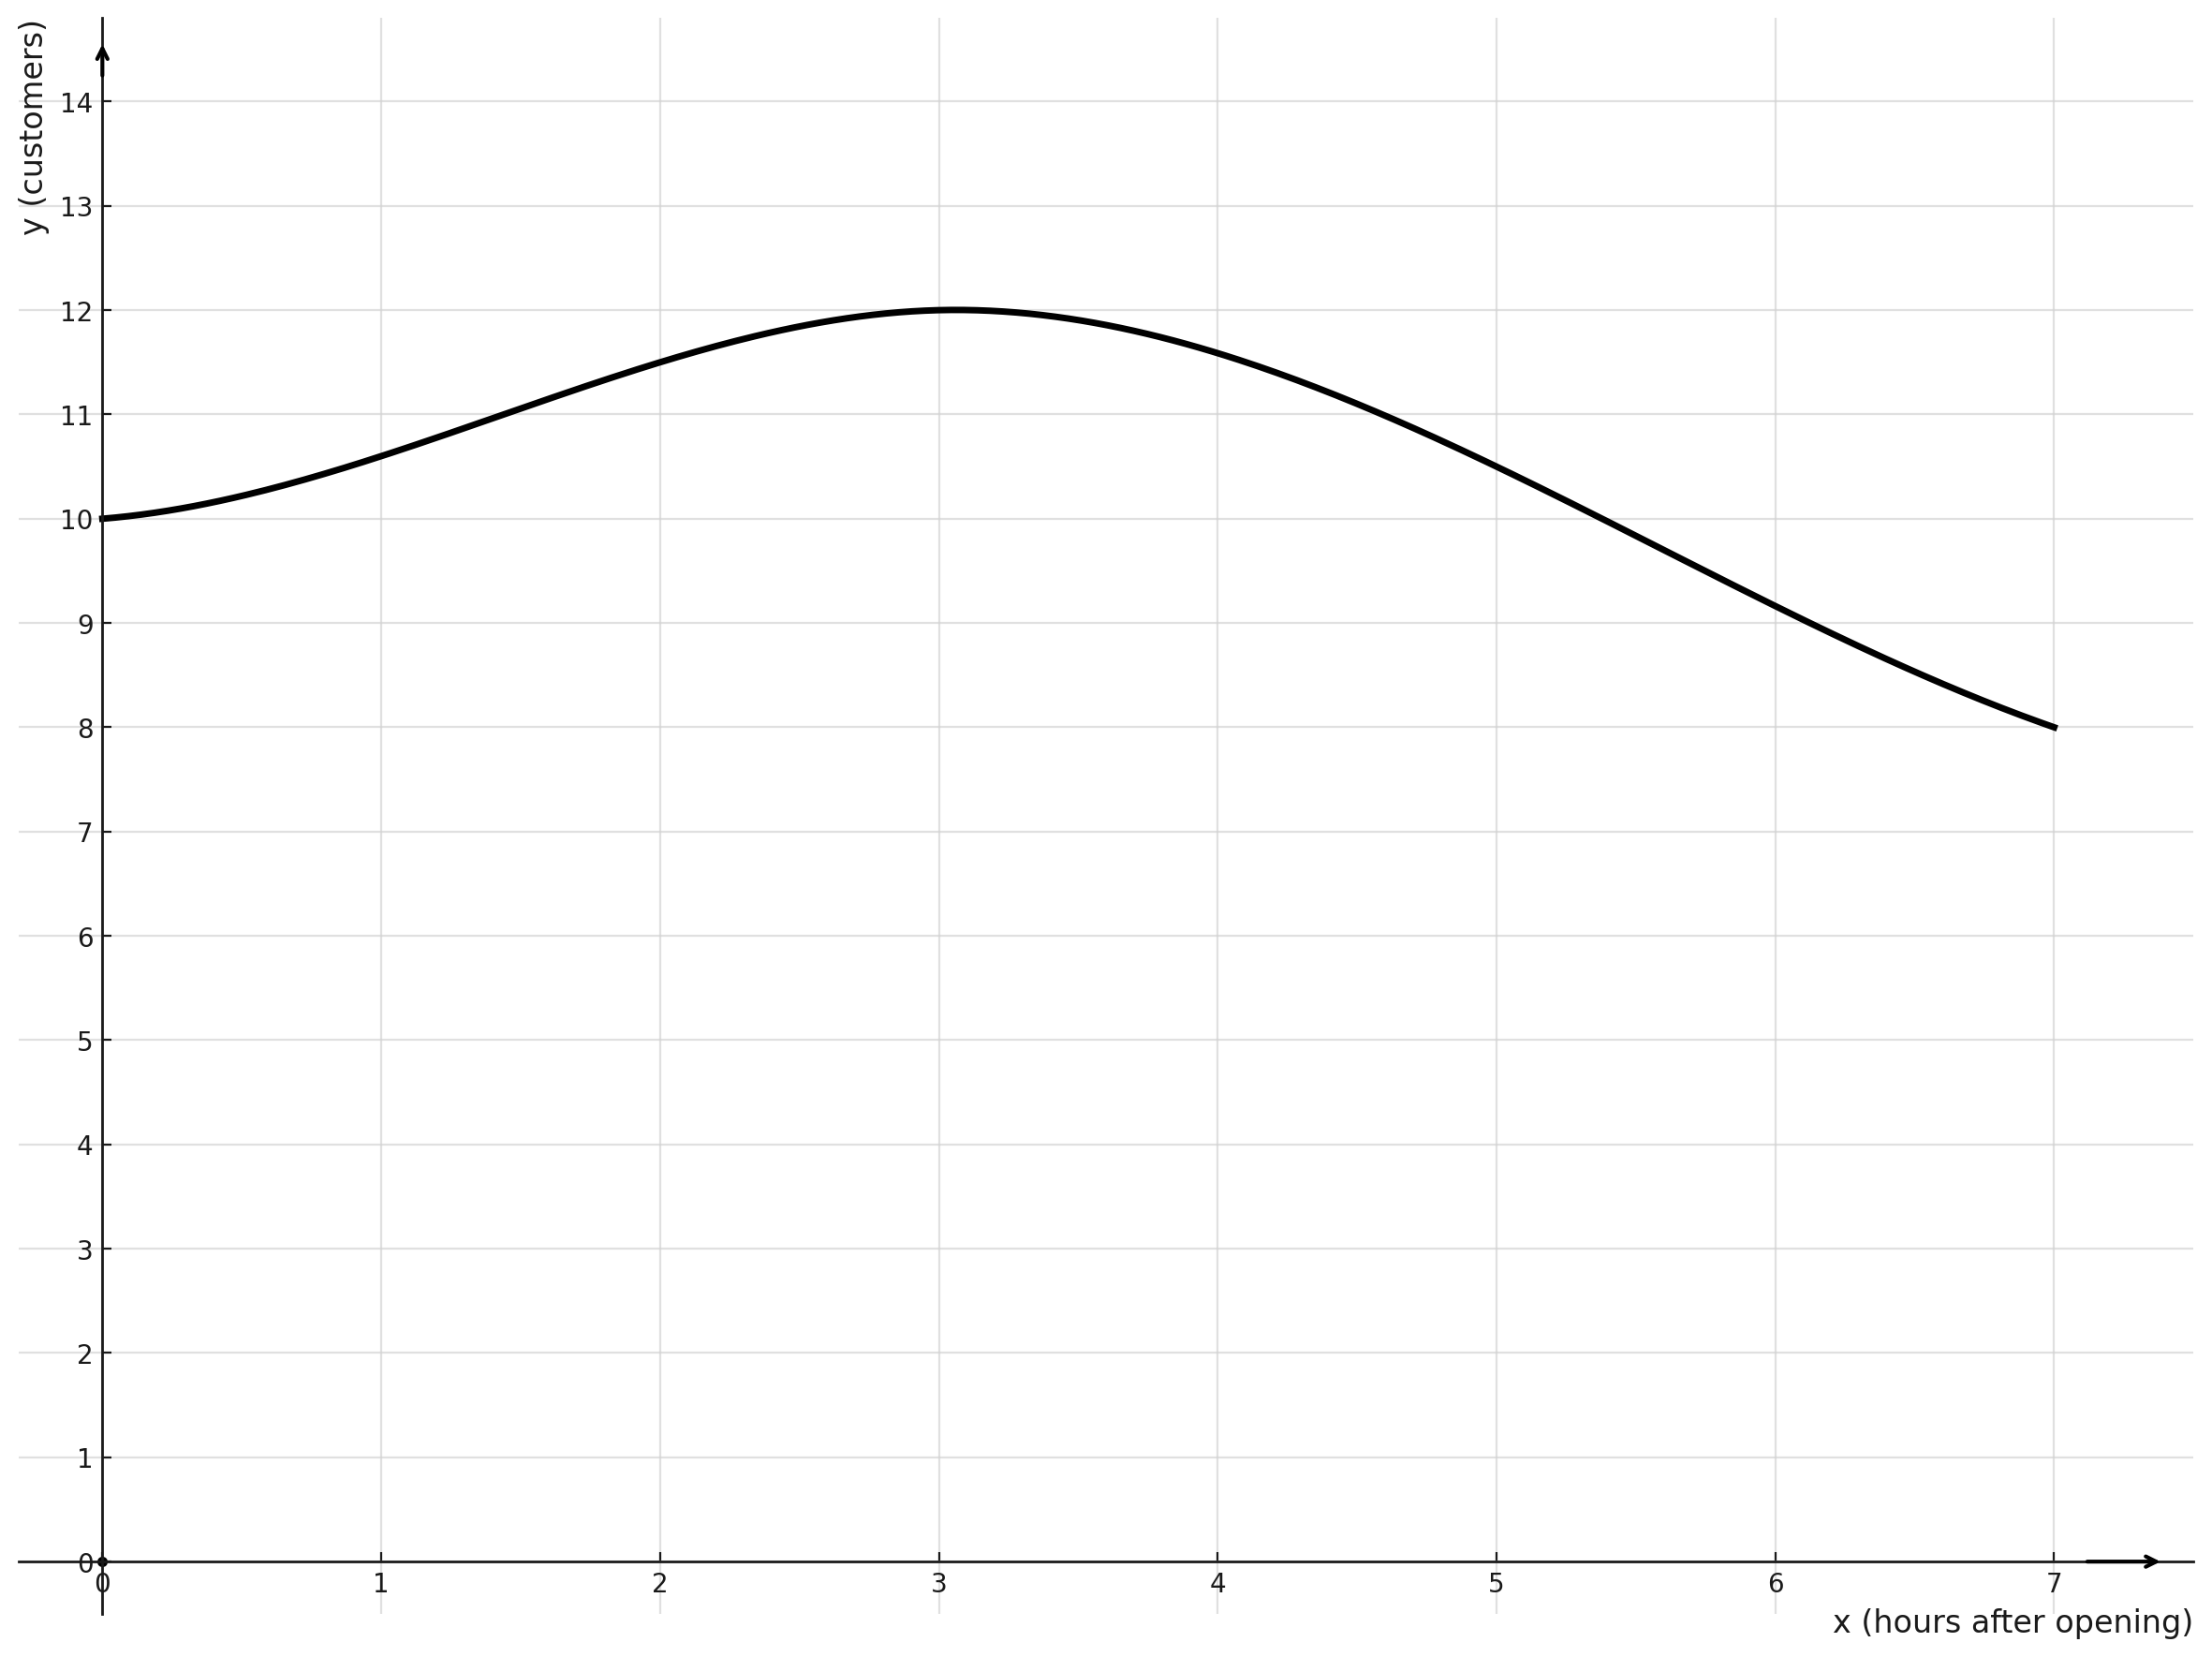
- The graph shows the modeled number \(\mathrm{y}\) of customers in a help-desk queue \(\mathrm{x}\) hours after the center opens, for \(0 \leq \mathrm{x} \leq 7\).
- The curve is smooth and concave downward over the interval, as shown in the figure.
- According to the model, how many customers are in the queue at the moment the center opens?
\(\mathrm{7}\)
\(\mathrm{9}\)
\(\mathrm{10}\)
\(\mathrm{12}\)
1. TRANSLATE the problem information
The key question asks: "How many customers are in the queue at the moment the center opens?"
- TRANSLATE this timing phrase:
- "At the moment the center opens" = \(\mathrm{x = 0}\) hours
- We're looking for the number of customers (\(\mathrm{y}\)) when no time has passed yet (\(\mathrm{x = 0}\))
2. VISUALIZE what we need from the graph
We need to find the y-value where the curve intersects the y-axis.
- The y-axis is where \(\mathrm{x = 0}\)
- This intersection point is called the y-intercept
- Look at the leftmost point of the curve, where it touches the vertical axis
3. VISUALIZE and read the y-intercept
Looking at the graph at \(\mathrm{x = 0}\):
- The curve starts at \(\mathrm{y = 10}\) on the vertical axis
- The point is \(\mathrm{(0, 10)}\)
- This means 10 customers are in the queue at opening time
Answer: C (10)
Why Students Usually Falter on This Problem
Most Common Error Path:
Weak TRANSLATE skill: Students may misinterpret "at the moment the center opens" and think it refers to a different time point, such as:
- The maximum point on the curve (around \(\mathrm{x = 3, y = 12}\))
- The endpoint when the center closes (\(\mathrm{x = 7, y = 8}\))
- Some other notable feature of the graph
If they confuse "opening" with "peak business time," they might identify the maximum value and select Choice D (12).
Second Most Common Error:
Poor VISUALIZE execution: Students may misread the y-axis scale or estimate the y-intercept incorrectly:
- Reading the grid lines incorrectly
- Estimating the starting point as closer to 9 or 8
- Confusing which axis represents which variable
This could lead them to select Choice B (9) if they underestimate the y-intercept, or Choice A (7) if they severely misread the graph.
The Bottom Line:
This problem tests whether students can connect verbal descriptions of time ("at the moment the center opens") to mathematical representations (\(\mathrm{x = 0}\)) and then accurately read values from a graph. The challenge isn't in complex calculations but in careful TRANSLATION of language to mathematics and precise VISUALIZATION of graph features.
\(\mathrm{7}\)
\(\mathrm{9}\)
\(\mathrm{10}\)
\(\mathrm{12}\)