The histograms summarize the distributions of number of units sold, in thousands, for company A and company B.Company A Histogram:...
GMAT Problem-Solving and Data Analysis : (PS_DA) Questions
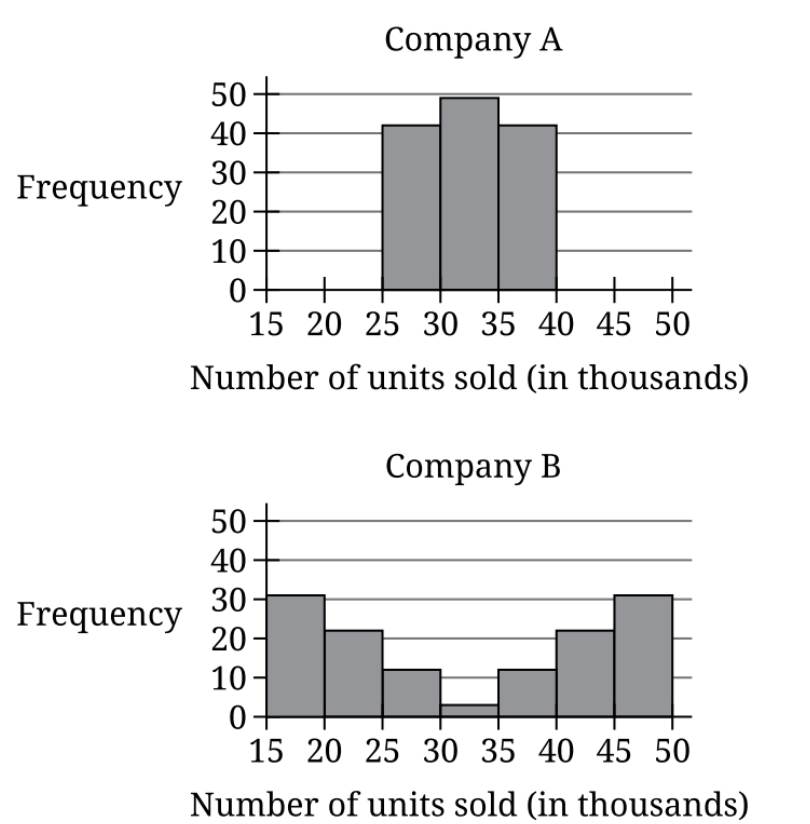
The histograms summarize the distributions of number of units sold, in thousands, for company A and company B.
Company A Histogram: Bell-shaped distribution centered around 30-35 thousand units, with frequencies reaching up to 50, showing most data concentrated in the 25-40 range
Company B Histogram: More spread out distribution with multiple peaks, showing data distributed across 15-50 thousand units range with varying frequencies up to about 30
Which statement best compares the standard deviations of number of units sold for these companies?
The standard deviation of number of units sold for company A is less than the standard deviation of number of units sold for company B.
The standard deviation of number of units sold for company A is greater than the standard deviation of number of units sold for company B.
The standard deviation of number of units sold for company A is equal to the standard deviation of number of units sold for company B.
There is not enough information to compare the standard deviations.
1. VISUALIZE the information in both histograms
Look at each histogram carefully:
Company A:
- The bars are concentrated in a narrow range (mostly 25-40 thousand)
- The distribution forms a bell shape with one clear peak
- Highest frequency is around 50 in the 30-35 range
- Very few (if any) values outside the 25-40 range
Company B:
- The bars spread across a wide range (15-50 thousand)
- Multiple peaks with varying heights
- Frequencies around 30 at both ends (15-20 and 45-50)
- Lower frequencies in the middle
2. INFER what standard deviation tells us
Standard deviation measures how spread out data is from the mean:
- Small standard deviation = values clustered close to the mean
- Large standard deviation = values spread far from the mean
The question asks us to compare spreads, not calculate exact values.
3. INFER the location of each mean
Both distributions are roughly symmetric (balanced on both sides):
- For symmetric distributions, the mean is at the center
- Company A: Center is in the 30-35 thousand bar
- Company B: Center is also around 30-35 thousand (middle of 15-50 range)
Both companies have similar means!
4. VISUALIZE and compare the spread from each mean
Now that we know both means are around 30-35 thousand:
Company A spread:
- Almost all data is within 5-10 thousand units of the mean
- Tightly clustered: 25-30, 30-35, 35-40 ranges contain nearly all values
Company B spread:
- Data extends 15-20 thousand units away from the mean in both directions
- Wide dispersion: significant frequencies in 15-20 and 45-50 ranges
- Values are much farther from the mean
5. INFER which standard deviation is larger
Since Company A's values cluster close to its mean → smaller standard deviation
Since Company B's values spread far from its mean → larger standard deviation
Therefore: Standard deviation of Company A \(\lt\) Standard deviation of Company B
Answer: A
Why Students Usually Falter on This Problem
Most Common Error Path:
Weak VISUALIZE skill: Students may focus on the different shapes of the histograms (bell-shaped vs. multi-peaked) rather than comparing the actual spread of values.
They might think: "These distributions look completely different, so I need to calculate something" or "Company A looks more 'normal' so it must have a different standard deviation relationship."
This leads to confusion and guessing, potentially selecting Choice D (not enough information) because they think they need numerical data to compare standard deviations.
Second Most Common Error:
Weak INFER skill: Students may not recognize that standard deviation is about distance from the mean, failing to identify that both distributions have similar centers.
They might focus on: "Company A has higher frequency bars" and incorrectly think higher frequencies mean larger standard deviation, or they might think the different visual appearance means different means.
This may lead them to select Choice B (Company A greater than Company B) by incorrectly associating the taller bars or more concentrated appearance with larger standard deviation.
The Bottom Line:
This problem requires visual comparison skills rather than calculation. Students must translate the visual spread they see into understanding of standard deviation. The key insight is recognizing that spread (not shape, not frequency heights, not symmetry) determines standard deviation, and that visual comparison is sufficient when histograms share the same scale.
The standard deviation of number of units sold for company A is less than the standard deviation of number of units sold for company B.
The standard deviation of number of units sold for company A is greater than the standard deviation of number of units sold for company B.
The standard deviation of number of units sold for company A is equal to the standard deviation of number of units sold for company B.
There is not enough information to compare the standard deviations.