The graph shows the predicted value y, in dollars, of a certain investment portfolio x years after the initial investment....
GMAT Advanced Math : (Adv_Math) Questions
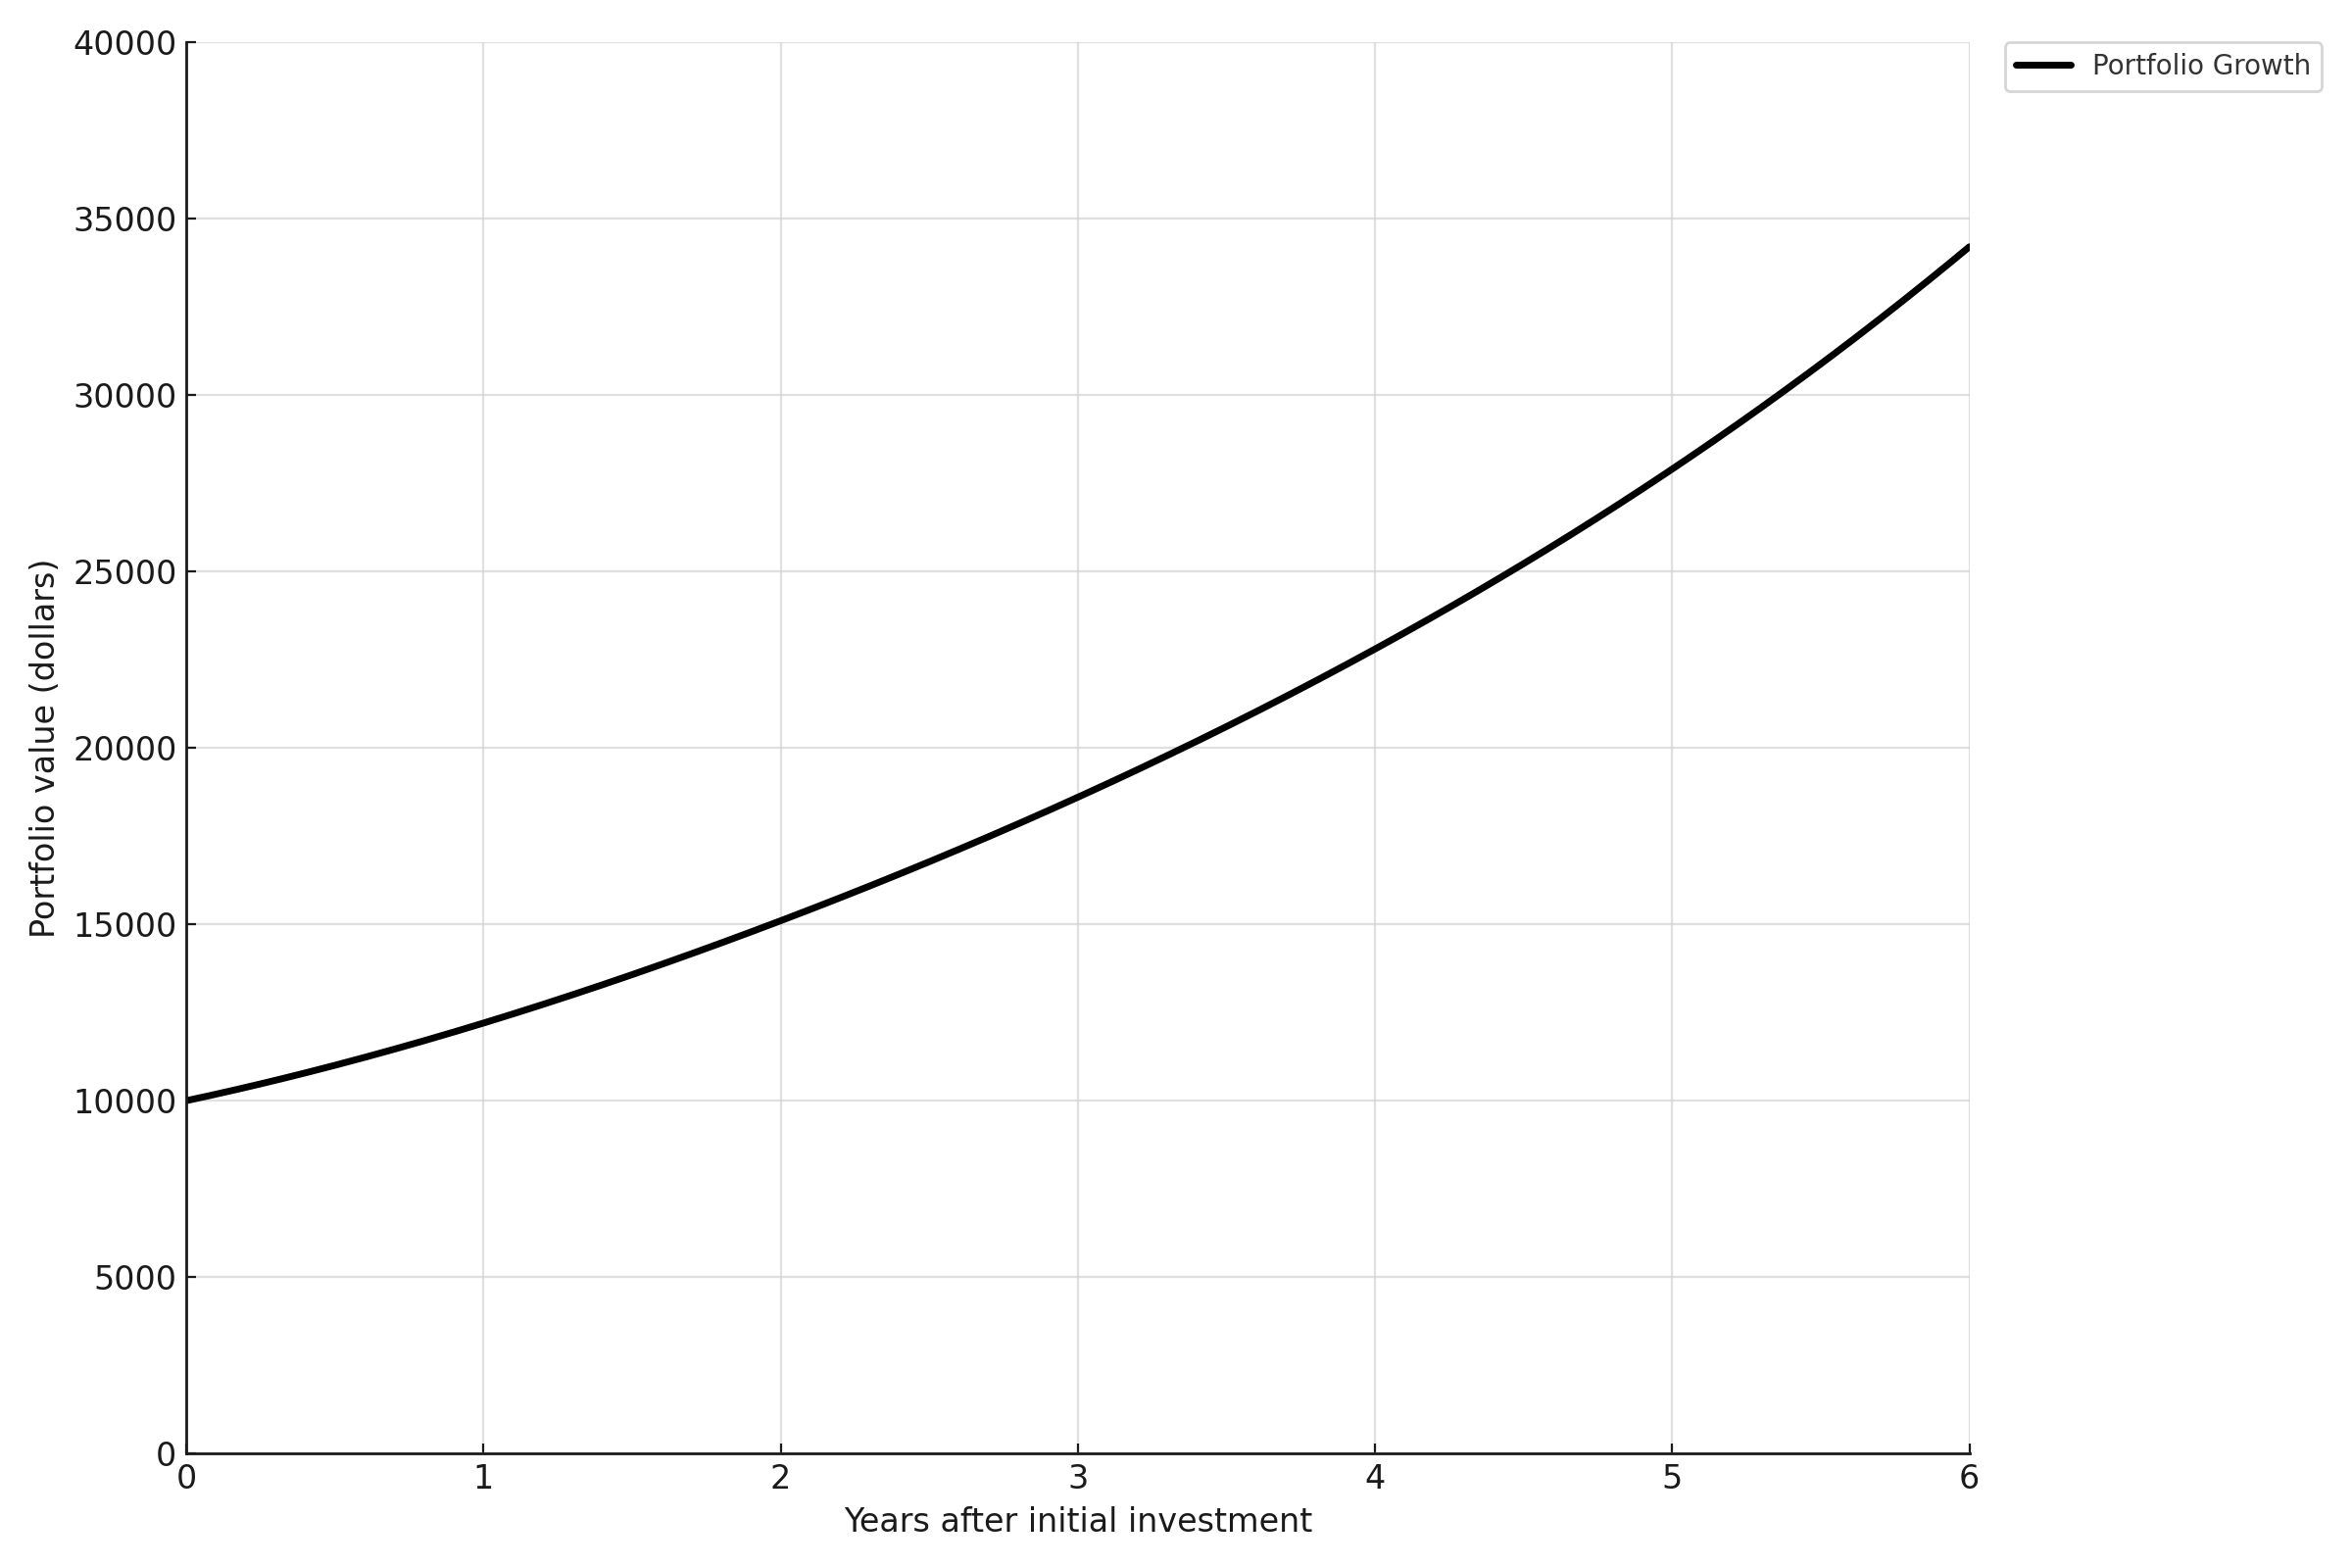
The graph shows the predicted value y, in dollars, of a certain investment portfolio x years after the initial investment. Which of the following is closest to the predicted value of the investment portfolio 4 years after the initial investment?
\(\$18,650\)
\(\$22,800\)
\(\$27,200\)
\(\$31,500\)
1. TRANSLATE the problem into graph coordinates
The question asks for the "predicted value of the investment portfolio 4 years after the initial investment."
- TRANSLATE this to graph language:
- "4 years after the initial investment" → \(\mathrm{x = 4}\)
- "predicted value" → the y-coordinate at \(\mathrm{x = 4}\)
We need to find: What is \(\mathrm{y}\) when \(\mathrm{x = 4}\)?
2. INFER the graph reading strategy
To find the portfolio value at any point in time:
- Locate the time (x-value) on the horizontal axis
- Trace vertically upward to meet the curve
- Trace horizontally left to read the dollar value (y-value)
3. Locate x = 4 on the horizontal axis
Find where \(\mathrm{x = 4}\) sits on the "Years after initial investment" axis. This is between \(\mathrm{x = 3}\) and \(\mathrm{x = 5}\), positioned at the fourth major vertical gridline.
4. Trace vertically to the portfolio growth curve
From \(\mathrm{x = 4}\), move straight up until you hit the black curve. This is your intersection point.
5. Read the y-value from the vertical axis
From the intersection point, trace horizontally left to the y-axis. Look carefully at where this horizontal line crosses the "Portfolio value (dollars)" axis.
The curve at \(\mathrm{x = 4}\) aligns with approximately $22,800 on the y-axis.
6. Match to answer choices
Checking our answer against the choices:
- (A) $18,650 - too low
- (B) $22,800 - matches our reading ✓
- (C) $27,200 - too high
- (D) $31,500 - much too high
Answer: B ($22,800)
Why Students Usually Falter on This Problem
Most Common Error Path:
Imprecise graph reading
(Process Skill: Graph interpretation accuracy): Students may misalign their visual tracing when moving from \(\mathrm{x = 4}\) up to the curve, or when moving from the intersection point left to the y-axis. The gridlines might cause confusion, especially if students don't carefully follow a straight vertical or horizontal path.
For example, if students trace slightly off-angle or misjudge the position between gridlines, they might read a value closer to $18,650 or $27,200.
This may lead them to select Choice A ($18,650) if they read too low, or Choice C ($27,200) if they read too high.
Second Most Common Error:
Weak TRANSLATE skill: Students might misidentify what they're looking for on the graph. They might confuse "4 years after initial investment" with looking at the portfolio growth rate, the change in value, or even reading the wrong axis.
This confusion about what to extract from the graph causes them to get stuck and guess among the answer choices.
The Bottom Line:
This problem tests careful graph reading more than mathematical computation. The key is precisely translating the question into graph coordinates (finding \(\mathrm{x = 4}\)) and then accurately tracing to read the corresponding y-value. Small misalignments in visual tracing can lead to selecting adjacent wrong answers.
\(\$18,650\)
\(\$22,800\)
\(\$27,200\)
\(\$31,500\)