The line graph shows a student's scores on 8 quizzes in a biology class.The student's average (arithmetic mean) score for...
GMAT Problem-Solving and Data Analysis : (PS_DA) Questions
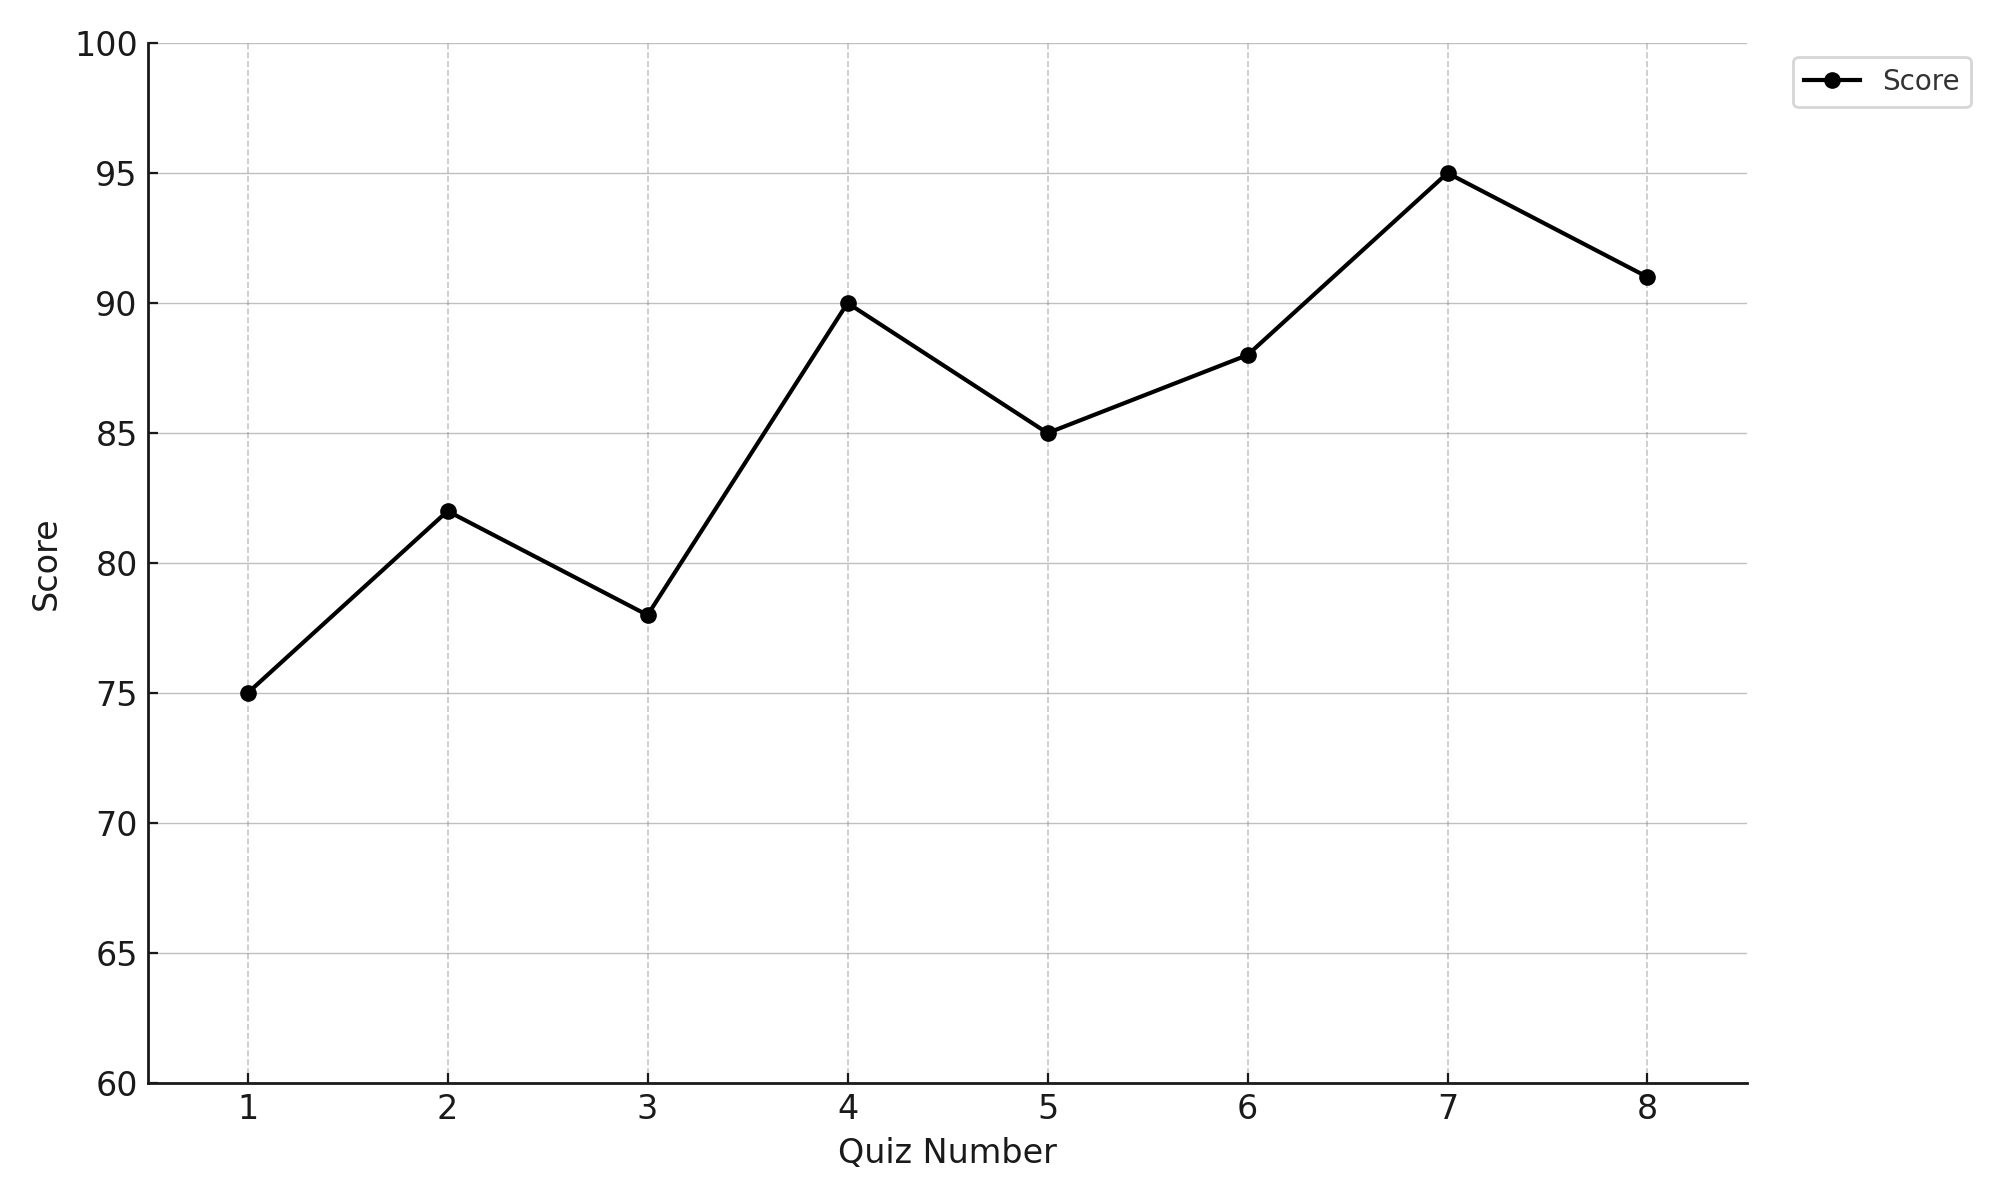
- The line graph shows a student's scores on 8 quizzes in a biology class.
- The student's average (arithmetic mean) score for all 8 quizzes was \(\mathrm{85.5}\).
- What was the student's score on Quiz 5?
1. TRANSLATE the question into a graph-reading task
The question asks: "What was the student's score on Quiz 5?"
- This means I need to:
- Find Quiz 5 on the x-axis (horizontal axis)
- Locate the corresponding point on the line
- Read the score value on the y-axis (vertical axis)
2. INFER which information is relevant
- Given information:
- A line graph showing scores for 8 quizzes
- The average score for all 8 quizzes was 85.5
- Need to find the score on Quiz 5
- Key insight: The average score is extra information. I don't need to calculate anything—I just need to read directly from the graph!
3. TRANSLATE the graph reading into a specific value
- Locate "5" on the x-axis (Quiz Number)
- Move straight up from "5" until I hit the black dot on the line
- From that dot, move horizontally left to the y-axis
- Read the value where my horizontal line intersects the y-axis
The data point for Quiz 5 lines up exactly with the gridline labeled 85.
Answer: 85
Why Students Usually Falter on This Problem
Most Common Error Path:
Weak TRANSLATE skill: Students misalign the data point with the gridlines when reading the y-value.
For example, they might:
- Read slightly above or below the actual point
- Estimate between gridlines when the point is actually on a gridline
- Read the score from a neighboring quiz (Quiz 4 at 90 or Quiz 6 at 88)
This leads to selecting an incorrect value like 84, 86, 88, or 90 instead of the correct answer of 85.
Second Most Common Error:
Over-application of given information: Students see the average score of 85.5 and assume they need to use it in a calculation.
They might:
- Try to work backward from the average
- Attempt to verify their graph reading using the average
- Second-guess their direct reading because 85 is close to 85.5
- Get confused about whether the question wants them to calculate something
This can lead to confusion and uncertainty, even when they've correctly read 85 from the graph, causing them to change their answer or guess.
The Bottom Line:
This problem tests whether students can distinguish between relevant and extraneous information, and whether they can accurately read values from a line graph using proper alignment with gridlines. The simplicity of the question (just read the graph!) can actually cause students to overthink it and look for a more complex solution than necessary.