The line graph shows the number of graduates from the classes of 2001 through 2007 at a certain school who...
GMAT Problem-Solving and Data Analysis : (PS_DA) Questions
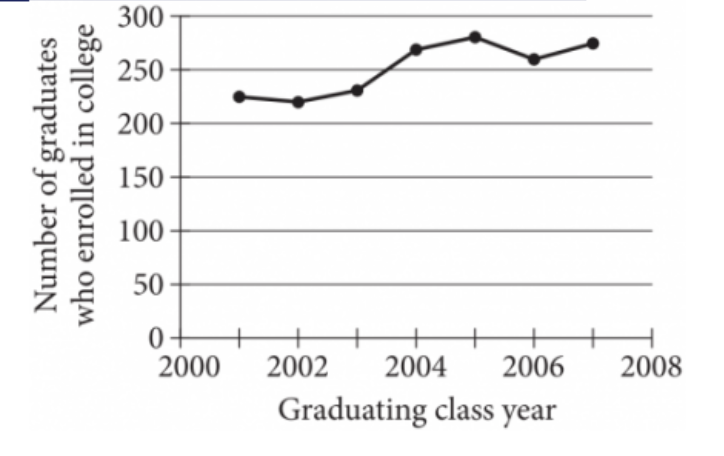
The line graph shows the number of graduates from the classes of 2001 through 2007 at a certain school who enrolled in college within 24 months of graduation. Of the following, which class had the fewest graduates who enrolled in college within 24 months of graduation?
1. TRANSLATE the question into a graph-reading task
The question asks: "Which class had the fewest graduates who enrolled in college within 24 months?"
- Key translation: "Fewest" means we're looking for the smallest number or minimum value
- On a line graph, this means finding the lowest point on the vertical axis
- What we need to do: Compare all the data points and identify which year has the lowest value
2. Systematically examine each data point
Working from left to right across the graph:
- 2001: The point is at approximately 225 on the vertical axis
- 2002: The point is at approximately 220 on the vertical axis ← This is the lowest point visually
- 2003: The point is at approximately 235 on the vertical axis
- 2004: The point is at approximately 270 on the vertical axis
- 2005: The point is at approximately 280 on the vertical axis (this appears to be the highest point)
- 2006: The point is at approximately 260 on the vertical axis
- 2007: The point is at approximately 275 on the vertical axis
3. Identify the minimum value
Looking at all the values, 2002 has the lowest point on the graph at approximately 220 graduates.
Answer: A. 2002
Why Students Usually Falter on This Problem
Most Common Error Path:
TRANSLATE error - Misinterpreting "fewest": Some students misread "fewest" as "most" and look for the maximum value instead of the minimum value.
The highest point on the graph occurs around 2005 (approximately 280 graduates). Students making this error would select Choice C (2005) instead of the correct answer.
Second Most Common Error:
Incomplete visual analysis: Students may not systematically check all data points and instead make a quick visual judgment that's incorrect. For example, they might focus only on the later years (2004-2007) because those values are higher overall, and miss that 2002 is actually the lowest point.
If they only compare 2004, 2005, and 2007 (the choices given besides 2002), they might select Choice B (2004) thinking it's the lowest among those years, but this would be wrong because they didn't check all the years including 2002.
The Bottom Line:
This problem tests your ability to correctly TRANSLATE the meaning of "fewest" into finding a minimum value on a graph. The key is understanding what you're looking for (smallest, not largest) and then systematically checking all data points to find it. Don't rush—look at every year on the graph before making your selection.