The line graph shows the number of visitors, in thousands, to a website for the first six months of a...
GMAT Problem-Solving and Data Analysis : (PS_DA) Questions
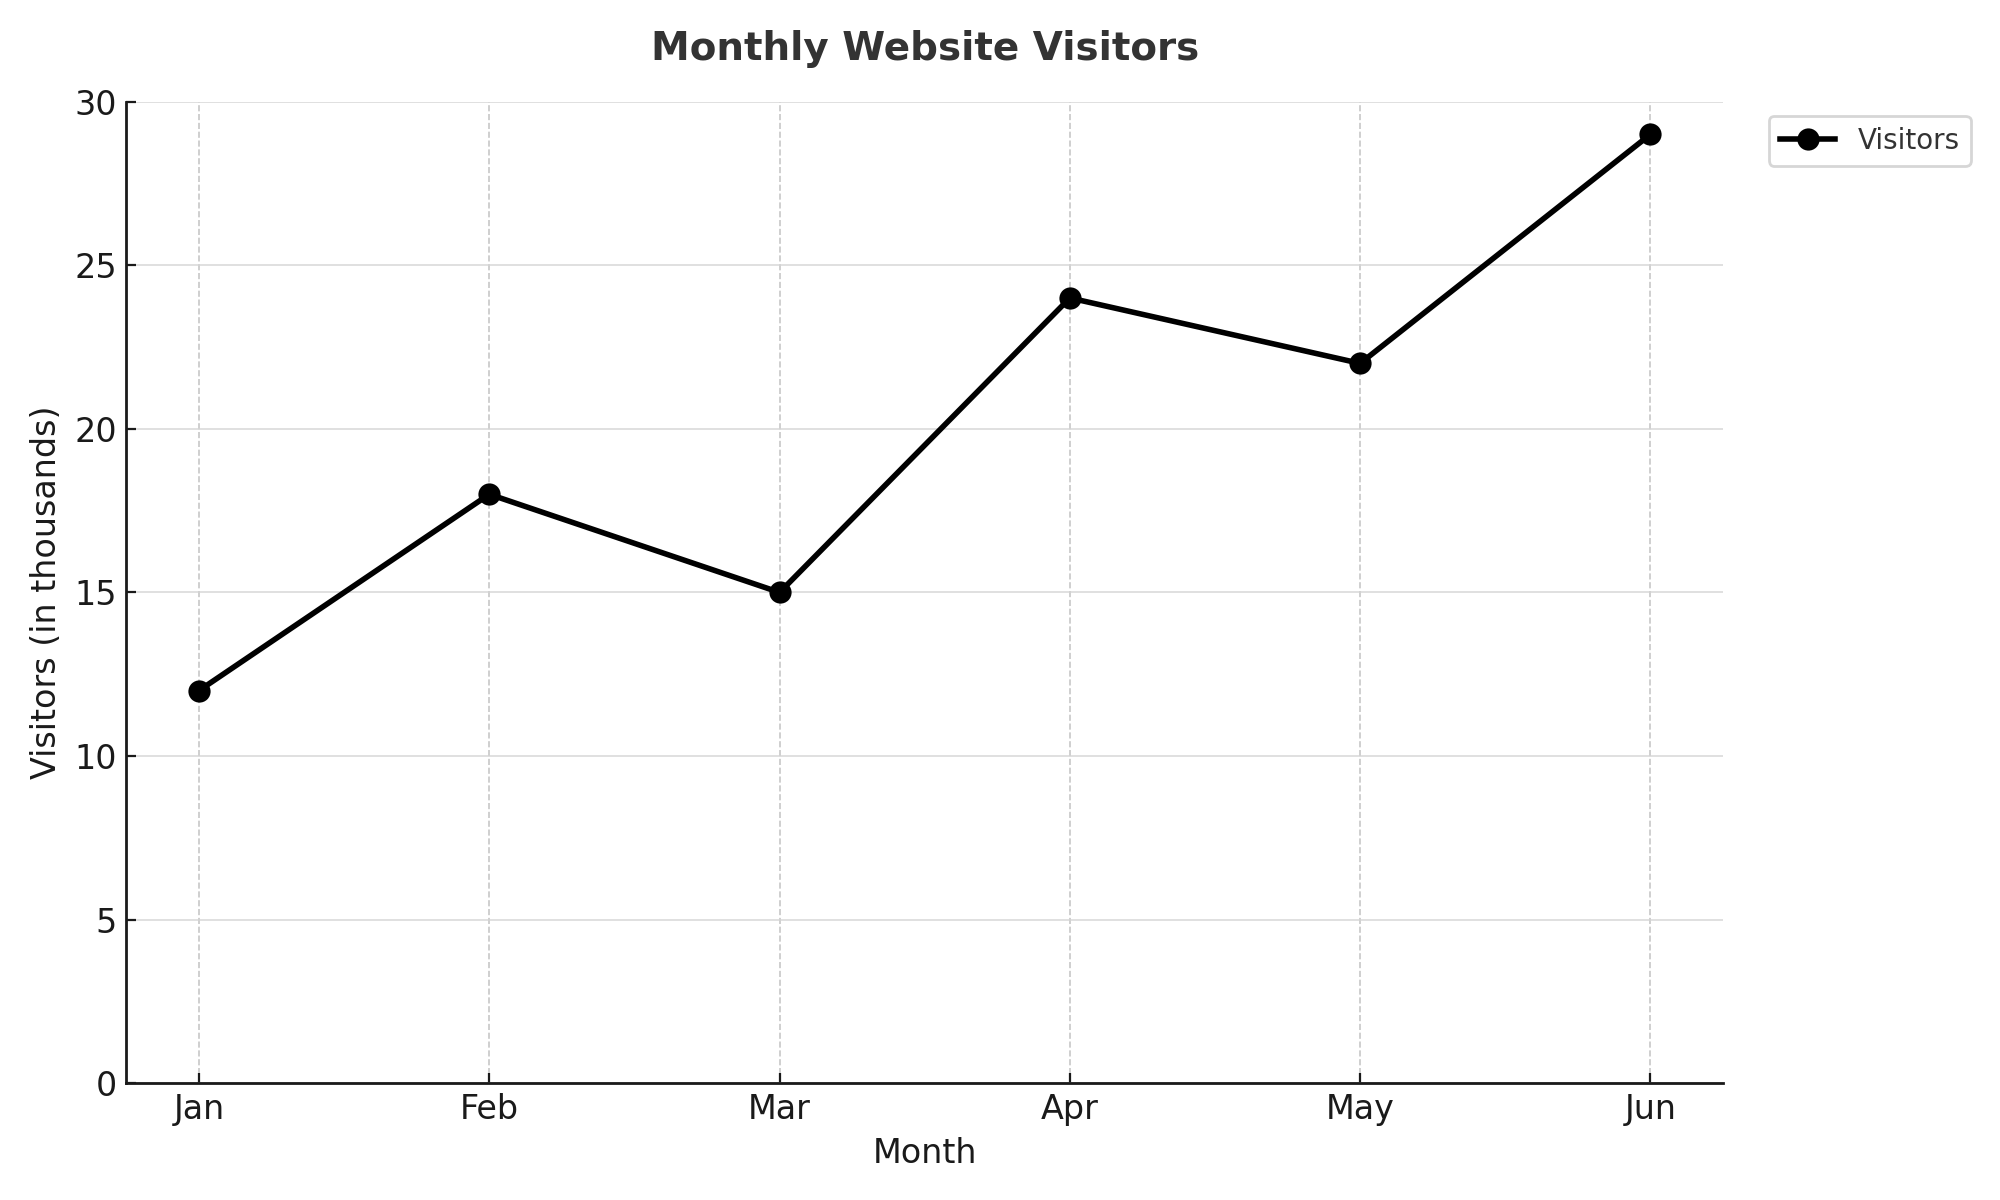
The line graph shows the number of visitors, in thousands, to a website for the first six months of a year. By how many thousands did the number of visitors increase from February to April?
4
6
8
10
1. TRANSLATE the problem information
The question asks: "By how many thousands did the number of visitors increase from February to April?"
This tells us we need to:
- Find the number of visitors in February
- Find the number of visitors in April
- Calculate how much the number grew (the increase)
2. TRANSLATE the graph data for February
Locate "Feb" on the horizontal (x) axis. Now trace straight up until you hit the data point (the black dot). From that point, trace horizontally left to the vertical (y) axis.
- February visitors = 18 thousand
3. TRANSLATE the graph data for April
Locate "Apr" on the horizontal axis. Trace straight up to the data point, then horizontally left to the vertical axis.
- April visitors = 24 thousand
4. INFER how to calculate the increase
To find how much something increased, we subtract the starting value from the ending value:
- We're going FROM February TO April
- So we calculate: April value - February value
5. Calculate the difference
Increase = \(24 - 18 = 6\) thousand
Answer: B (6)
Why Students Usually Falter on This Problem
Most Common Error Path:
TRANSLATE failure: Misreading the graph values
Students may rush when reading the y-axis and misidentify where the data points fall. For example:
- Reading February as 16 instead of 18 (off by one grid line)
- Reading April as 22 instead of 24 (off by one grid line)
If a student reads February as 18 but April as 22, they calculate \(22 - 18 = 4\), leading them to select Choice A (4).
Second Most Common Error:
INFER failure: Subtracting in the wrong order
Some students might calculate February - April instead of April - February:
- \(18 - 24 = -6\)
Seeing a negative number, they might either:
- Take the absolute value and still get 6 (correctly arriving at Choice B (6) by luck)
- Realize their error and reverse the subtraction
- Get confused about what to do with a negative answer and guess
The Bottom Line:
This problem tests careful graph reading skills. The math is simple once you have the right numbers, but accuracy in reading the data points is critical. Always double-check where each point aligns on the y-axis before calculating.
4
6
8
10