Oxygen gas is placed inside a tank with a constant volume. The graph shows the estimated temperature y, in kelvins,...
GMAT Algebra : (Alg) Questions
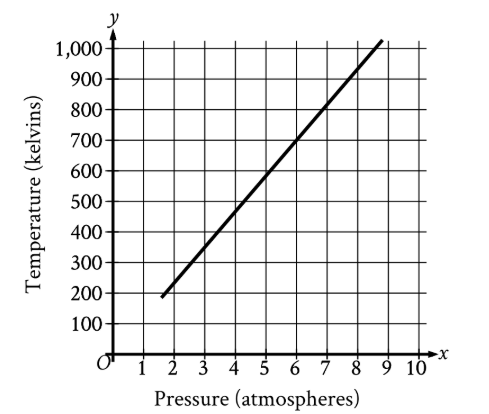
Oxygen gas is placed inside a tank with a constant volume. The graph shows the estimated temperature \(\mathrm{y}\), in kelvins, of the oxygen gas when its pressure is \(\mathrm{x}\) atmospheres. What is the estimated temperature, in kelvins, of the oxygen gas when its pressure is \(\mathrm{6}\) atmospheres?
6
60
700
760
1. TRANSLATE the graph axes and question
Given information from the graph:
- x-axis (horizontal): Pressure in atmospheres
- y-axis (vertical): Temperature in kelvins
- A straight line showing the relationship between pressure and temperature
What the question asks:
"What is the estimated temperature when pressure is 6 atmospheres?"
TRANSLATE this into graph reading language:
- Find the point on the line where \(\mathrm{x = 6}\)
- Report the y-coordinate of that point
2. VISUALIZE the process of reading the graph
Locate the x-value:
- Find 6 on the horizontal axis (pressure)
- This is between 5 and 7 on the x-axis
Trace to the line:
- Move vertically upward from \(\mathrm{x = 6}\) until you hit the line
- This intersects the line at a specific point
Read the y-value:
- From the intersection point, trace horizontally to the y-axis
- Read the temperature value on the vertical scale
- The point appears to be at \(\mathrm{y = 700}\) kelvins
3. Select the answer
The y-coordinate when \(\mathrm{x = 6}\) is approximately 700.
Answer: C. 700
Why Students Usually Falter on This Problem
Most Common Error Path:
Weak TRANSLATE skill: Students misunderstand what value they're supposed to find. They see "when pressure is 6 atmospheres" and think the answer is 6, confusing the input value (\(\mathrm{x = 6}\)) with the output value (\(\mathrm{y = ?}\)).
What goes wrong: They read the question as asking "what is the pressure?" instead of "what is the temperature at that pressure?" Since the question explicitly states \(\mathrm{pressure = 6}\) atmospheres, they select that value.
This leads them to select Choice A (6).
Second Most Common Error:
Poor VISUALIZE execution: Students misread the y-axis scale or incorrectly trace from \(\mathrm{x = 6}\) to the line. The gridlines show intervals of 100 kelvins, and students might:
- Land between gridlines and round incorrectly
- Miscount the gridlines
- Read a nearby value instead of the correct one
This causes them to select Choice B (60) or Choice D (760) depending on their reading error.
The Bottom Line:
This problem tests whether students can translate a word question into a graph-reading task and correctly identify which coordinate (x or y) answers the question. The key is recognizing that "when pressure is 6" gives you the x-value, and you need to find the corresponding y-value (temperature).
6
60
700
760