The graph shows a scatterplot of data set G with a line of best fit. The line of best fit...
GMAT Problem-Solving and Data Analysis : (PS_DA) Questions
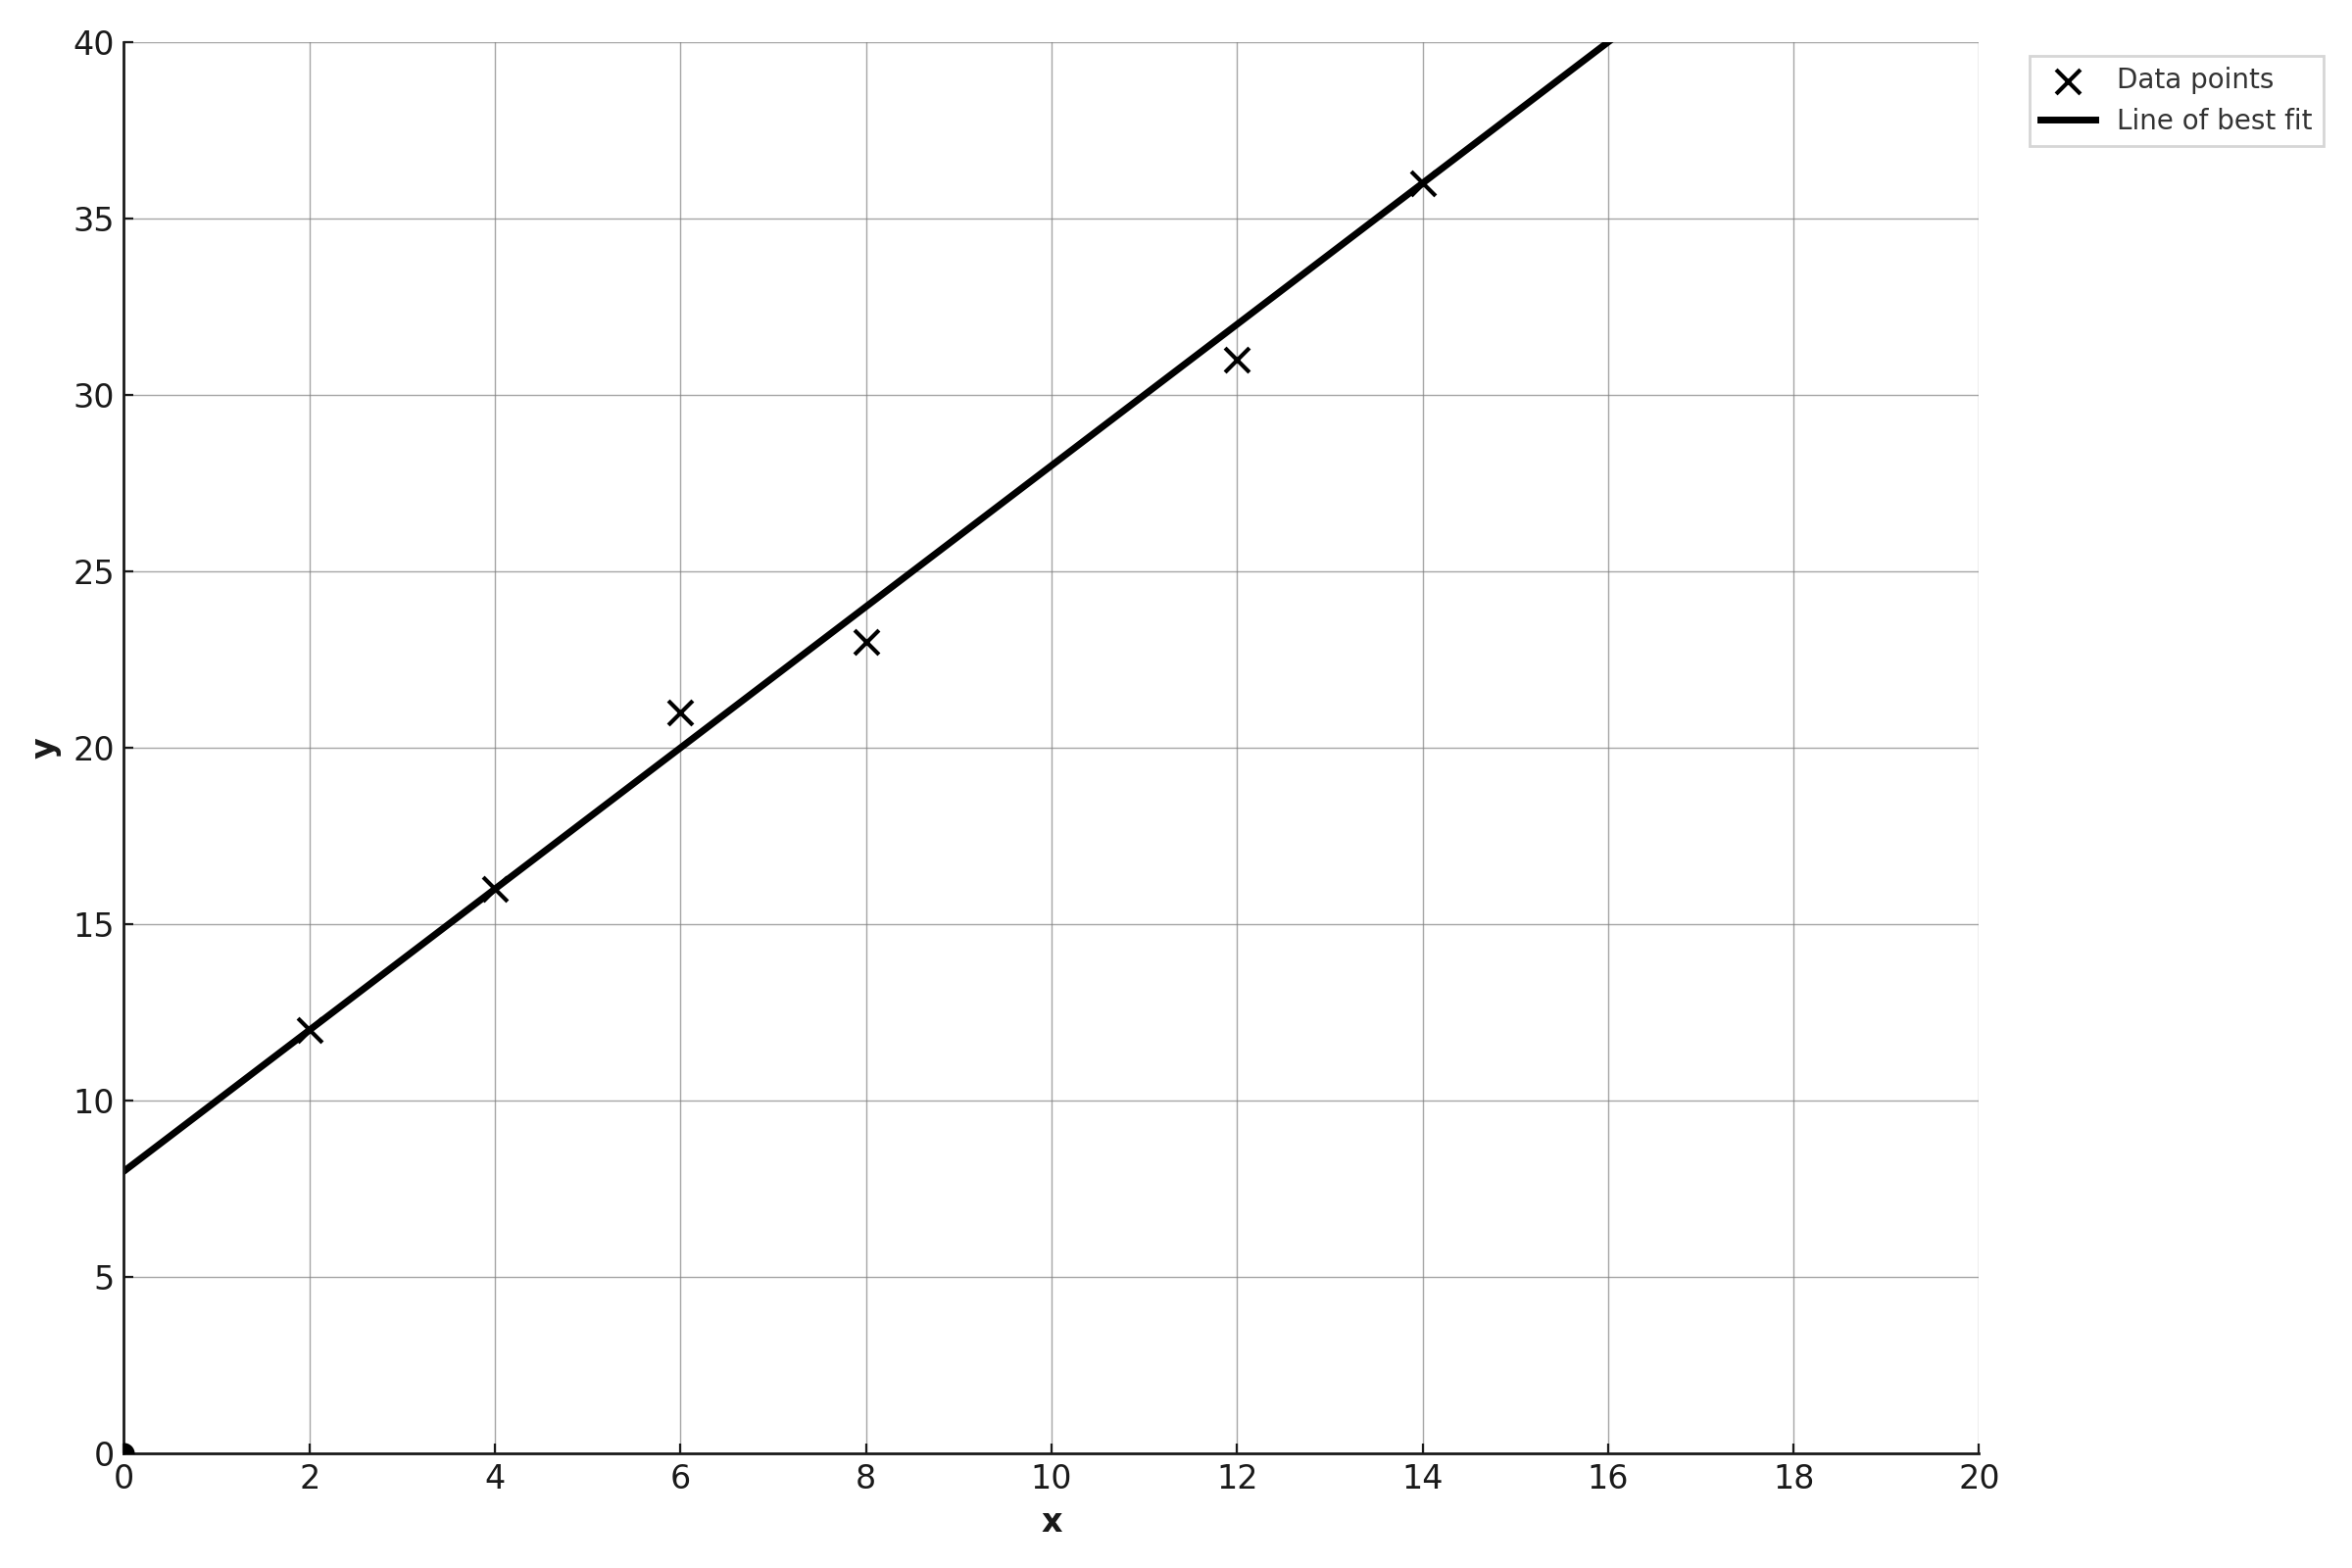
The graph shows a scatterplot of data set G with a line of best fit. The line of best fit crosses the \(\mathrm{y}\)-axis at 8 and passes through the point \(\mathrm{(10, 28)}\). A new data set H is formed by replacing each response value \(\mathrm{y}\) from data set G with \(\mathrm{Y = 0.5y + 6}\). Which of the following could be an equation of a line of best fit for data set H?
\(\mathrm{Y = x + 10}\)
\(\mathrm{Y = 0.5x + 10}\)
\(\mathrm{Y = x + 6}\)
\(\mathrm{Y = 2x + 6}\)
1. TRANSLATE the graph information into an equation
From the graph and problem statement, we need to identify:
- The line of best fit crosses the y-axis at 8
- This tells us the y-intercept: \(\mathrm{b = 8}\)
- The line passes through point (10, 28)
- We have a second point: \(\mathrm{(10, 28)}\)
2. TRANSLATE the slope using two points
Using the slope formula with points \(\mathrm{(0, 8)}\) and \(\mathrm{(10, 28)}\):
- \(\mathrm{m = \frac{28 - 8}{10 - 0}}\)
- \(\mathrm{m = \frac{20}{10} = 2}\)
So the equation of the line of best fit for data set G is:
\(\mathrm{y = 2x + 8}\)
3. TRANSLATE the transformation rule
Data set H is formed by transforming each y-value from data set G:
- Transformation: \(\mathrm{Y = 0.5y + 6}\)
- This means every y-value gets multiplied by 0.5, then we add 6
4. INFER the strategy for finding the new line
Since the transformation applies to all y-values in the data set, it also transforms the line of best fit. We need to substitute the entire equation \(\mathrm{y = 2x + 8}\) into the transformation formula.
5. SIMPLIFY by substituting and combining
Substitute \(\mathrm{y = 2x + 8}\) into \(\mathrm{Y = 0.5y + 6}\):
- \(\mathrm{Y = 0.5(2x + 8) + 6}\)
- \(\mathrm{Y = x + 4 + 6}\)
- \(\mathrm{Y = x + 10}\)
Answer: (A) \(\mathrm{Y = x + 10}\)
Why Students Usually Falter on This Problem
Most Common Error Path:
Weak INFER skill: Students may not recognize that the transformation applies to the entire line equation, not just individual points. Instead, they might try to transform individual points from the scatterplot and then find a new line, which is extremely time-consuming and impractical.
Alternatively, students might misunderstand how the transformation affects the line equation. For example, they might incorrectly think that transforming \(\mathrm{Y = 0.5y + 6}\) means simply multiplying the slope and y-intercept separately (getting \(\mathrm{Y = 0.5(2)x + 0.5(8) + 6 = x + 4 + 6}\)... which actually works but through faulty reasoning), or they might forget to add the "+6" at the end.
This confusion leads to guessing among the answer choices.
Second Most Common Error:
Poor SIMPLIFY execution: Students correctly set up \(\mathrm{Y = 0.5(2x + 8) + 6}\) but make algebraic errors during simplification:
- Forgetting to distribute: \(\mathrm{Y = 0.5(2x) + 8 + 6 = x + 14}\)
- Incorrect distribution: \(\mathrm{Y = x + 8 + 6 = x + 14}\)
- Forgetting to add the 6: \(\mathrm{Y = 0.5(2x + 8) = x + 4}\)
Any of these errors would lead to selecting Choice (C) (\(\mathrm{Y = x + 6}\)) or selecting no answer that matches, causing confusion and guessing.
The Bottom Line:
This problem tests whether students understand that linear transformations of data sets transform the equation of the line of best fit through substitution. The key insight is recognizing that \(\mathrm{Y = 0.5y + 6}\) transforms every point on the line, so we substitute the entire equation \(\mathrm{y = 2x + 8}\) to get the new line equation. Without this conceptual understanding, students resort to inefficient point-by-point methods or make strategic errors.
\(\mathrm{Y = x + 10}\)
\(\mathrm{Y = 0.5x + 10}\)
\(\mathrm{Y = x + 6}\)
\(\mathrm{Y = 2x + 6}\)