In the given scatterplot, a line of best fit for the data is shown. Which of the following is closest...
GMAT Problem-Solving and Data Analysis : (PS_DA) Questions
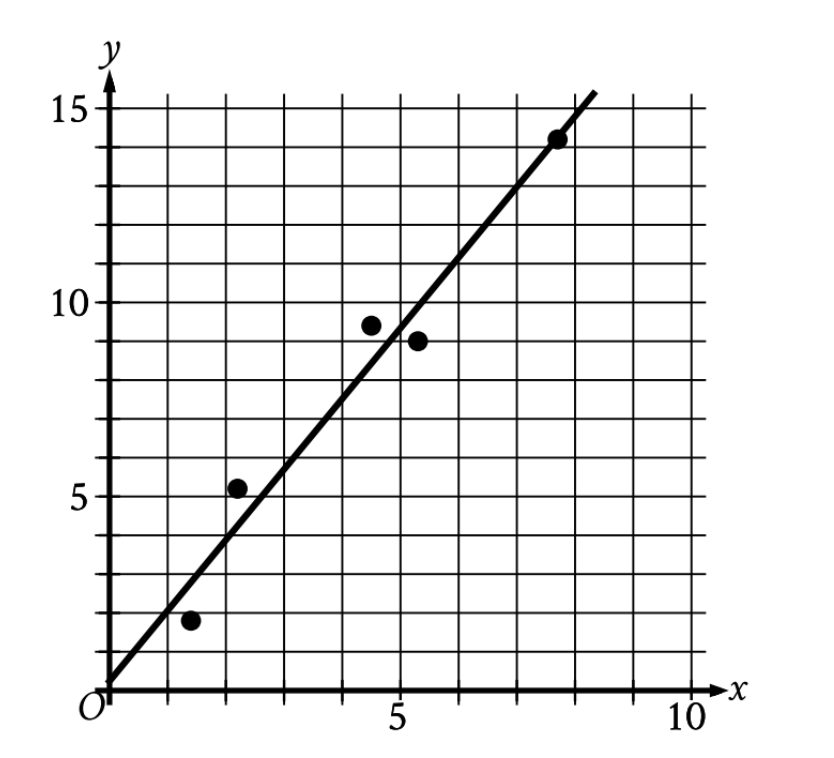
In the given scatterplot, a line of best fit for the data is shown. Which of the following is closest to the slope of the line of best fit shown?
1. TRANSLATE the graph information into usable coordinates
To find the slope of any line, I need two points that lie ON the line (not the scattered data points).
- Key distinction: The black dots are data points. The solid black line is the line of best fit. I need points FROM THE LINE.
- Looking at the line of best fit, I need to identify where it passes through clear positions on the grid:
- At x = 0, the line starts at approximately y = 0 (right at or very near the origin)
- At x = 8, the line passes through approximately y = 14
- So my two points are approximately: (0, 0) and (8, 14)
2. INFER which formula to use
- I need to find the slope of a line given two points
- The slope formula is: \(\mathrm{m = \frac{y_2 - y_1}{x_2 - x_1}}\)
3. SIMPLIFY by substituting values and calculating
- Using points (0, 0) and (8, 14):
\(\mathrm{m = \frac{14 - 0}{8 - 0} = \frac{14}{8}}\)
- Simplify: \(\mathrm{\frac{14}{8} = \frac{7}{4} = 1.75}\)
4. INFER which answer choice is closest
- My calculated slope is 1.75
- Looking at the choices:
- A. 0.2 (too small)
- B. 0.7 (too small)
- C. 1.8 (very close!)
- D. 2.6 (too large)
Answer: C. 1.8
Why Students Usually Falter on This Problem
Most Common Error Path:
TRANSLATE error - Confusing data points with points on the line: Students often try to use the coordinates of the actual data points (the dots) instead of identifying coordinates that lie on the line of best fit itself. For example, they might use two of the scattered dots like (4, 9.5) and (5, 9), which would give a slope of \(\mathrm{\frac{9-9.5}{5-4} = -0.5}\), leading to confusion since none of the answers are negative. This causes them to get stuck and guess randomly.
Second Most Common Error:
TRANSLATE error - Misreading the y-coordinate: When reading from the graph, students might misidentify the y-value at a given x-position. For instance, if they read the y-intercept as y = 2 instead of y ≈ 0, and the point at x = 8 as y = 4 instead of y ≈ 14, they might calculate slope = \(\mathrm{\frac{4-2}{8-0} = \frac{2}{8} = 0.25}\), leading them to select Choice A (0.2) as the closest value.
The Bottom Line:
This problem tests whether students can distinguish between scattered data points and the line that models them, then accurately extract coordinate information from a graph. The visual interpretation (TRANSLATE) is actually harder than the calculation itself.