In the given scatterplot, a line of best fit for the data is shown. Which of the following is closest...
GMAT Problem-Solving and Data Analysis : (PS_DA) Questions
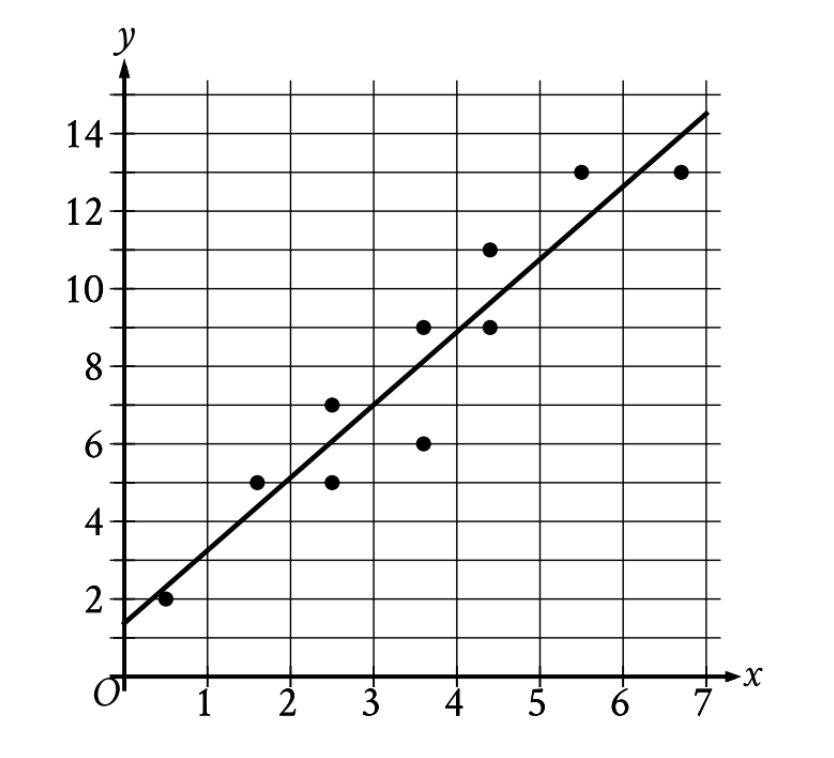
In the given scatterplot, a line of best fit for the data is shown. Which of the following is closest to the slope of the line of best fit shown?
\(0\)
\(\frac{1}{2}\)
\(1\)
\(2\)
1. VISUALIZE what you need from the graph
The key here is distinguishing between two things on the graph:
- The scattered data points (the individual dots)
- The line of best fit (the solid line drawn through the scatter)
You need to find the slope of the LINE, not work with individual data points.
2. VISUALIZE and select two points ON the line of best fit
Look for places where the line passes through or very close to grid intersections for accuracy:
- Point 1: When x = 1, the line passes through approximately y = 3
- Point 2: When x = 7, the line passes through approximately y = 15
Pro tip: Choose points that are far apart on the line for better accuracy. The farther apart, the less impact small reading errors have on your final answer.
3. TRANSLATE the coordinates
You have:
- \((x_1, y_1) = (1, 3)\)
- \((x_2, y_2) = (7, 15)\)
4. SIMPLIFY using the slope formula
\(\mathrm{Slope} = \frac{y_2 - y_1}{x_2 - x_1}\)
\(\mathrm{Slope} = \frac{15 - 3}{7 - 1}\)
\(\mathrm{Slope} = \frac{12}{6}\)
\(\mathrm{Slope} = 2\)
5. APPLY CONSTRAINTS by comparing to answer choices
Your calculated slope is 2, which is exactly choice D.
Answer: D. 2
Why Students Usually Falter on This Problem
Most Common Error Path:
Weak VISUALIZE skill: Students try to use the scattered data points instead of identifying points on the line of best fit itself.
They might pick two data points like \((2, 5)\) and \((4, 6)\), calculate the slope between those specific points, and get a slope of \(\frac{1}{2}\). But this is wrong because the line of best fit represents the overall trend, not the connection between any two individual data points. The scattered points don't all lie on the line—that's why it's called "best fit" rather than a perfect fit.
This error may lead them to select Choice B \(\frac{1}{2}\) if they happen to pick data points with a shallow connection, or get confused by inconsistent results if they try multiple data point pairs.
Second Most Common Error:
Poor TRANSLATE skill: Students misread the coordinates when trying to identify points on the line.
For example, they might read the y-coordinate at x = 7 as y = 7 (confusing the x and y values, or not carefully tracking grid lines). If they use points \((1, 3)\) and \((7, 7)\), they'd calculate \(\mathrm{slope} = \frac{7-3}{7-1} = \frac{4}{6} \approx 0.67\), which would round to somewhere between \(\frac{1}{2}\) and 1.
This error causes them to get stuck between Choice B \(\frac{1}{2}\) and Choice C (1), leading to guessing between these two.
The Bottom Line:
This problem tests whether you can distinguish between the data points and the trend line, then accurately read coordinates from a graph. The conceptual knowledge (slope formula) is straightforward, but the visual interpretation and careful reading make all the difference.
\(0\)
\(\frac{1}{2}\)
\(1\)
\(2\)