The scatterplot shows the relationship between two variables, x and y. A line of best fit is also shown. Which...
GMAT Problem-Solving and Data Analysis : (PS_DA) Questions
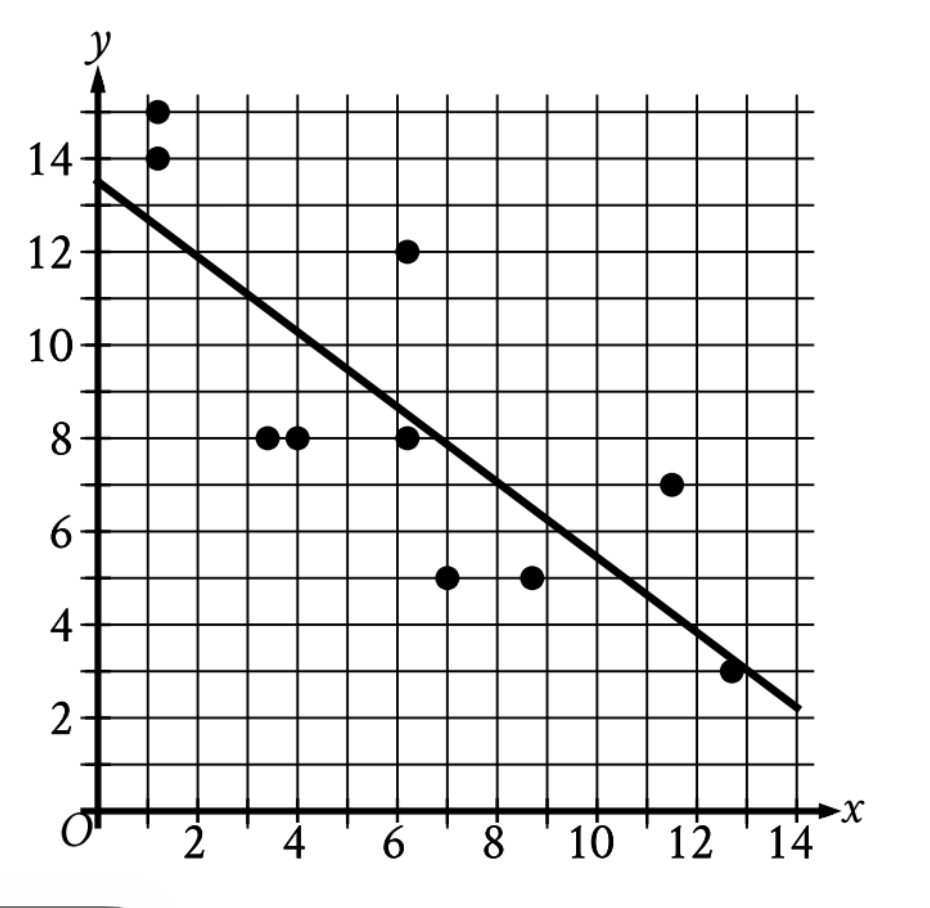
The scatterplot shows the relationship between two variables, x and y. A line of best fit is also shown.
Which of the following equations best represents the line of best fit shown?
Choose 1 answer:
1. VISUALIZE the key features of the line
Looking at the graph, identify two critical features:
- Direction of the line: Does it go up or down as you move left to right?
- This line clearly goes downward from left to right
- Y-intercept location: Where does the line cross the y-axis?
- The line crosses the y-axis at approximately y = 13.5
- This is above zero, so it's a positive value
2. INFER what these features mean algebraically
Now connect what you see to the equation form \(\mathrm{y = a + bx}\):
- Downward direction means:
- The slope is negative
- In \(\mathrm{y = a + bx}\), we need 'b' to be negative
- This means we need a minus sign before the x term
- Positive y-intercept (13.5) means:
- The constant 'a' should be +13.5
- Not -13.5
3. TRANSLATE these requirements to the answer choices
Looking for: positive constant term (13.5) AND negative coefficient on x (-0.8)
- Choice A: \(\mathrm{y = 13.5 + 0.8x}\)
- Y-intercept: ✓ positive (13.5)
- Slope: ✗ positive (the \(\mathrm{+0.8x}\) means slope is +0.8, so line goes up)
- Choice B: \(\mathrm{y = 13.5 - 0.8x}\)
- Y-intercept: ✓ positive (13.5)
- Slope: ✓ negative (the \(\mathrm{-0.8x}\) means slope is -0.8, so line goes down)
- Choice C: \(\mathrm{y = -13.5 + 0.8x}\)
- Y-intercept: ✗ negative (-13.5 would cross below the x-axis)
- Slope: ✗ positive
- Choice D: \(\mathrm{y = -13.5 - 0.8x}\)
- Y-intercept: ✗ negative (-13.5)
- Slope: ✓ negative
Only Choice B matches both requirements!
Answer: B (\(\mathrm{y = 13.5 - 0.8x}\))
Why Students Usually Falter on This Problem
Most Common Error Path:
Weak TRANSLATE skill: Confusing which part of the equation represents which feature of the line
Students often mix up the roles of the constant term and the coefficient:
- They might think the sign in front of x only affects the x-term's value, not realizing it determines whether the entire line goes up or down
- Or they focus on calculating the exact slope from two points but make arithmetic errors with negative numbers
This confusion might lead them to select Choice A (\(\mathrm{y = 13.5 + 0.8x}\)) because they correctly identify the y-intercept as 13.5 but fail to recognize that \(\mathrm{+0.8x}\) gives a positive (upward) slope when the graph clearly shows a downward slope.
Second Most Common Error:
Poor VISUALIZE skill: Misidentifying where the line crosses the y-axis
Some students rush and don't carefully observe where the line intersects the y-axis. They might:
- Look at where data points cluster rather than where the line itself crosses
- Misread the scale and think the y-intercept is negative
This may lead them to select Choice D (\(\mathrm{y = -13.5 - 0.8x}\)) because they correctly identify the negative slope but incorrectly think the y-intercept is negative.
The Bottom Line:
This problem tests your ability to connect visual features of a graph to algebraic notation. The key is systematically checking both the y-intercept (positive or negative?) and the slope (upward or downward?) before selecting your answer. Don't just look at the numbers—pay attention to all the signs!