The scatterplot shows the relationship between two variables, x and y. A line of best fit is also shown. Which...
GMAT Problem-Solving and Data Analysis : (PS_DA) Questions
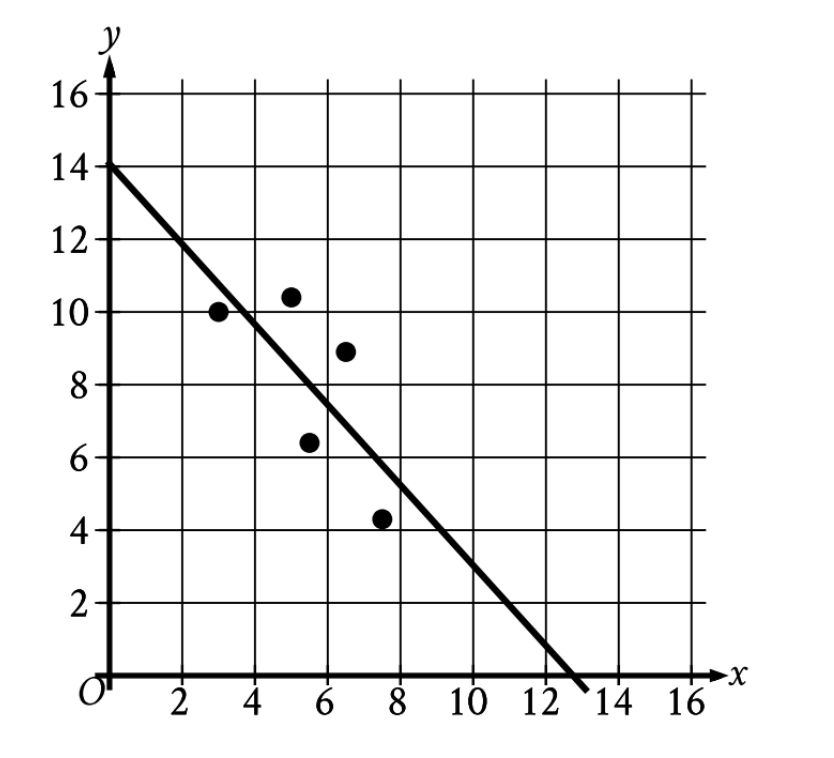
The scatterplot shows the relationship between two variables, x and y. A line of best fit is also shown. Which of the following is closest to the slope of this line of best fit?
1. VISUALIZE the line and identify two clear points
When finding the slope of a line from a graph, you need two points that lie on the line (not the scattered data points).
- Look for where the line of best fit crosses the axes - these give the cleanest coordinates:
- y-intercept: The line crosses the y-axis at (0, 14)
- x-intercept: The line crosses the x-axis at (13, 0)
Key insight: Use the line itself, not the individual data points scattered around it.
2. TRANSLATE the visual coordinates into mathematical form
Now that we've identified our two points from the graph:
- Point 1: \(\mathrm{(x_1, y_1) = (0, 14)}\)
- Point 2: \(\mathrm{(x_2, y_2) = (13, 0)}\)
3. INFER which formula to apply
Since we need the slope and have two points, we'll use the slope formula:
\(\mathrm{m = \frac{y_2 - y_1}{x_2 - x_1}}\)
4. SIMPLIFY by substituting and calculating
Substitute the coordinates:
\(\mathrm{m = \frac{0 - 14}{13 - 0}}\)
\(\mathrm{m = \frac{-14}{13}}\)
To compare with the answer choices, convert to decimal (use calculator):
\(\mathrm{m \approx -1.077}\)
5. APPLY CONSTRAINTS to select the closest answer
Looking at the choices:
- A. -3.3 (much steeper than our calculated value)
- B. -1.1 (very close to -1.077)
- C. 1.1 (positive, but our slope is negative)
- D. 3.3 (wrong sign and wrong magnitude)
Answer: B (-1.1)
Why Students Usually Falter on This Problem
Most Common Error Path #1:
VISUALIZE error - Misreading coordinates: Students may miscount grid squares or misidentify where the line crosses the axes. For example:
- Reading the y-intercept as (0, 13) instead of (0, 14)
- Reading the x-intercept as (12, 0) or (14, 0) instead of (13, 0)
If a student reads the points as (0, 13) and (12, 0), they would calculate:
\(\mathrm{m = \frac{0 - 13}{12 - 0} = \frac{-13}{12} \approx -1.08}\)
This still leads to Choice B (-1.1) by luck, but if they read (0, 14) and (4, 0):
\(\mathrm{m = \frac{0 - 14}{4 - 0} = \frac{-14}{4} = -3.5}\)
This could lead them to select Choice A (-3.3).
Most Common Error Path #2:
TRANSLATE error - Reversing the slope formula: Students may confuse rise over run and calculate \(\mathrm{\frac{x_2 - x_1}{y_2 - y_1}}\) instead:
\(\mathrm{m = \frac{13 - 0}{0 - 14} = \frac{13}{-14} = \frac{-13}{14} \approx -0.93}\)
This value doesn't match any answer choice closely, causing confusion and potentially leading to guessing or selecting Choice B (-1.1) as the "closest negative value near -1."
Most Common Error Path #3:
SIMPLIFY error - Dropping the negative sign: Students may correctly calculate \(\mathrm{|\frac{-14}{13}| = \frac{14}{13} \approx 1.1}\) but forget that the slope is negative because the line is decreasing.
This leads them to select Choice C (1.1) instead of the correct Choice B (-1.1).
The Bottom Line:
This problem tests whether students can accurately extract coordinates from a visual representation and correctly apply the slope formula. The most critical skills are careful graph reading and maintaining proper sign conventions throughout the calculation.