The scatterplot shows the relationship between two variables, x and y. A line of best fit for the data is...
GMAT Problem-Solving and Data Analysis : (PS_DA) Questions
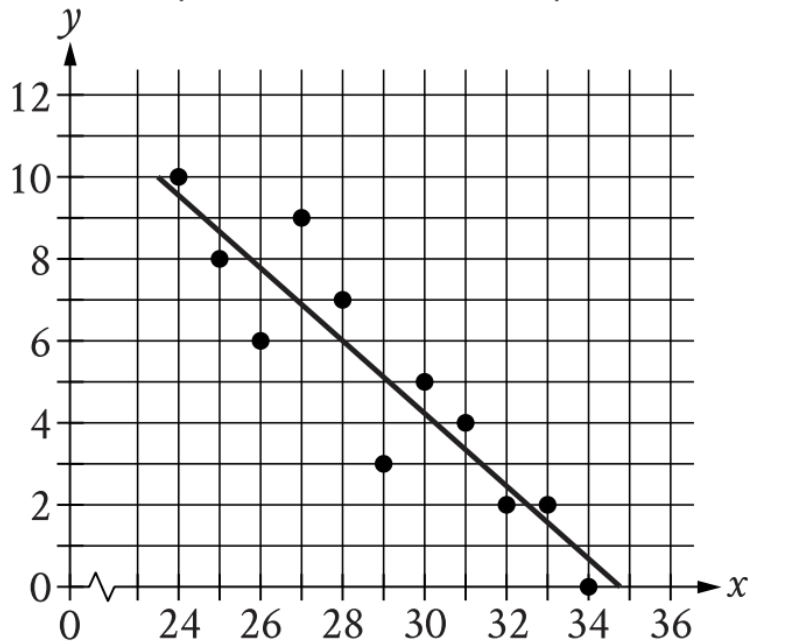
The scatterplot shows the relationship between two variables, x and y. A line of best fit for the data is also shown.
At \(\mathrm{x = 25.5}\), which of the following is closest to the y-value predicted by the line of best fit?
\(6.2\)
\(7.3\)
\(8.2\)
\(9.1\)
1. TRANSLATE the question
- What we're asked to find: The y-value predicted by the line of best fit when \(\mathrm{x = 25.5}\)
- What this means: We need to locate \(\mathrm{x = 25.5}\) on the graph and see what y-value the line of best fit gives us at that x-position
2. VISUALIZE the location on the graph
- Locate \(\mathrm{x = 25.5}\) on the horizontal axis:
- Find where 25 and 26 are marked
- \(\mathrm{x = 25.5}\) is exactly halfway between these two values
- Trace vertically upward to the line:
- From \(\mathrm{x = 25.5}\), imagine (or use a straightedge) drawing a vertical line up until it hits the line of best fit
- The y-coordinate of this intersection point is what we're looking for
3. INFER the y-value from the line
- Observe nearby points on the line:
- At \(\mathrm{x = 24}\), the line passes through approximately \(\mathrm{y = 10}\)
- At \(\mathrm{x = 26}\), the line passes through approximately \(\mathrm{y = 8}\)
- At \(\mathrm{x = 28}\), the line passes through approximately \(\mathrm{y = 7}\)
- Estimate the y-value at \(\mathrm{x = 25.5}\):
- Since 25.5 is between 25 and 26, and closer to 26
- The y-value should be slightly above 8
- A reasonable estimate is between 8 and 8.5
4. APPLY CONSTRAINTS to select the closest answer
- Compare our estimate (8 to 8.5) to the answer choices:
- A. 6.2 - Too far below our estimate
- B. 7.3 - Still below our estimate
- C. 8.2 - Right in the middle of our estimated range ✓
- D. 9.1 - Above our estimate
- Select the closest value: C. 8.2
Answer: C. 8.2
Why Students Usually Falter on This Problem
Most Common Error Path:
Weak VISUALIZE skill: Students may struggle to accurately locate \(\mathrm{x = 25.5}\) on the graph, especially since it falls between grid lines. They might:
- Accidentally read from \(\mathrm{x = 26}\) instead of \(\mathrm{x = 25.5}\)
- Confuse which line is the line of best fit versus reading from one of the data points
- Misread the scale on the y-axis
For example, if a student reads the y-value at \(\mathrm{x = 27}\) instead of \(\mathrm{x = 25.5}\), they would get approximately \(\mathrm{y = 7.3}\), leading them to select Choice B (7.3).
Second Most Common Error:
Poor APPLY CONSTRAINTS reasoning: Students may estimate the y-value correctly but then:
- Look for an exact match in the answer choices instead of the closest value
- Round incorrectly or arbitrarily
- Second-guess their visual estimate and select a value that "looks better" without proper justification
If a student estimates \(\mathrm{y ≈ 9}\) (reading slightly too high on the graph), they might select Choice D (9.1).
The Bottom Line:
This problem tests careful graph reading skills. The key challenge is that \(\mathrm{x = 25.5}\) falls between grid lines, requiring students to interpolate both horizontally (to find the x-position) and vertically (to estimate the y-value). Students must trust their visual estimation and select the closest answer choice, not an exact match.
\(6.2\)
\(7.3\)
\(8.2\)
\(9.1\)