The scatterplot shows paired data (x, y) and a line of best fit. At x = 27, which of the...
GMAT Problem-Solving and Data Analysis : (PS_DA) Questions
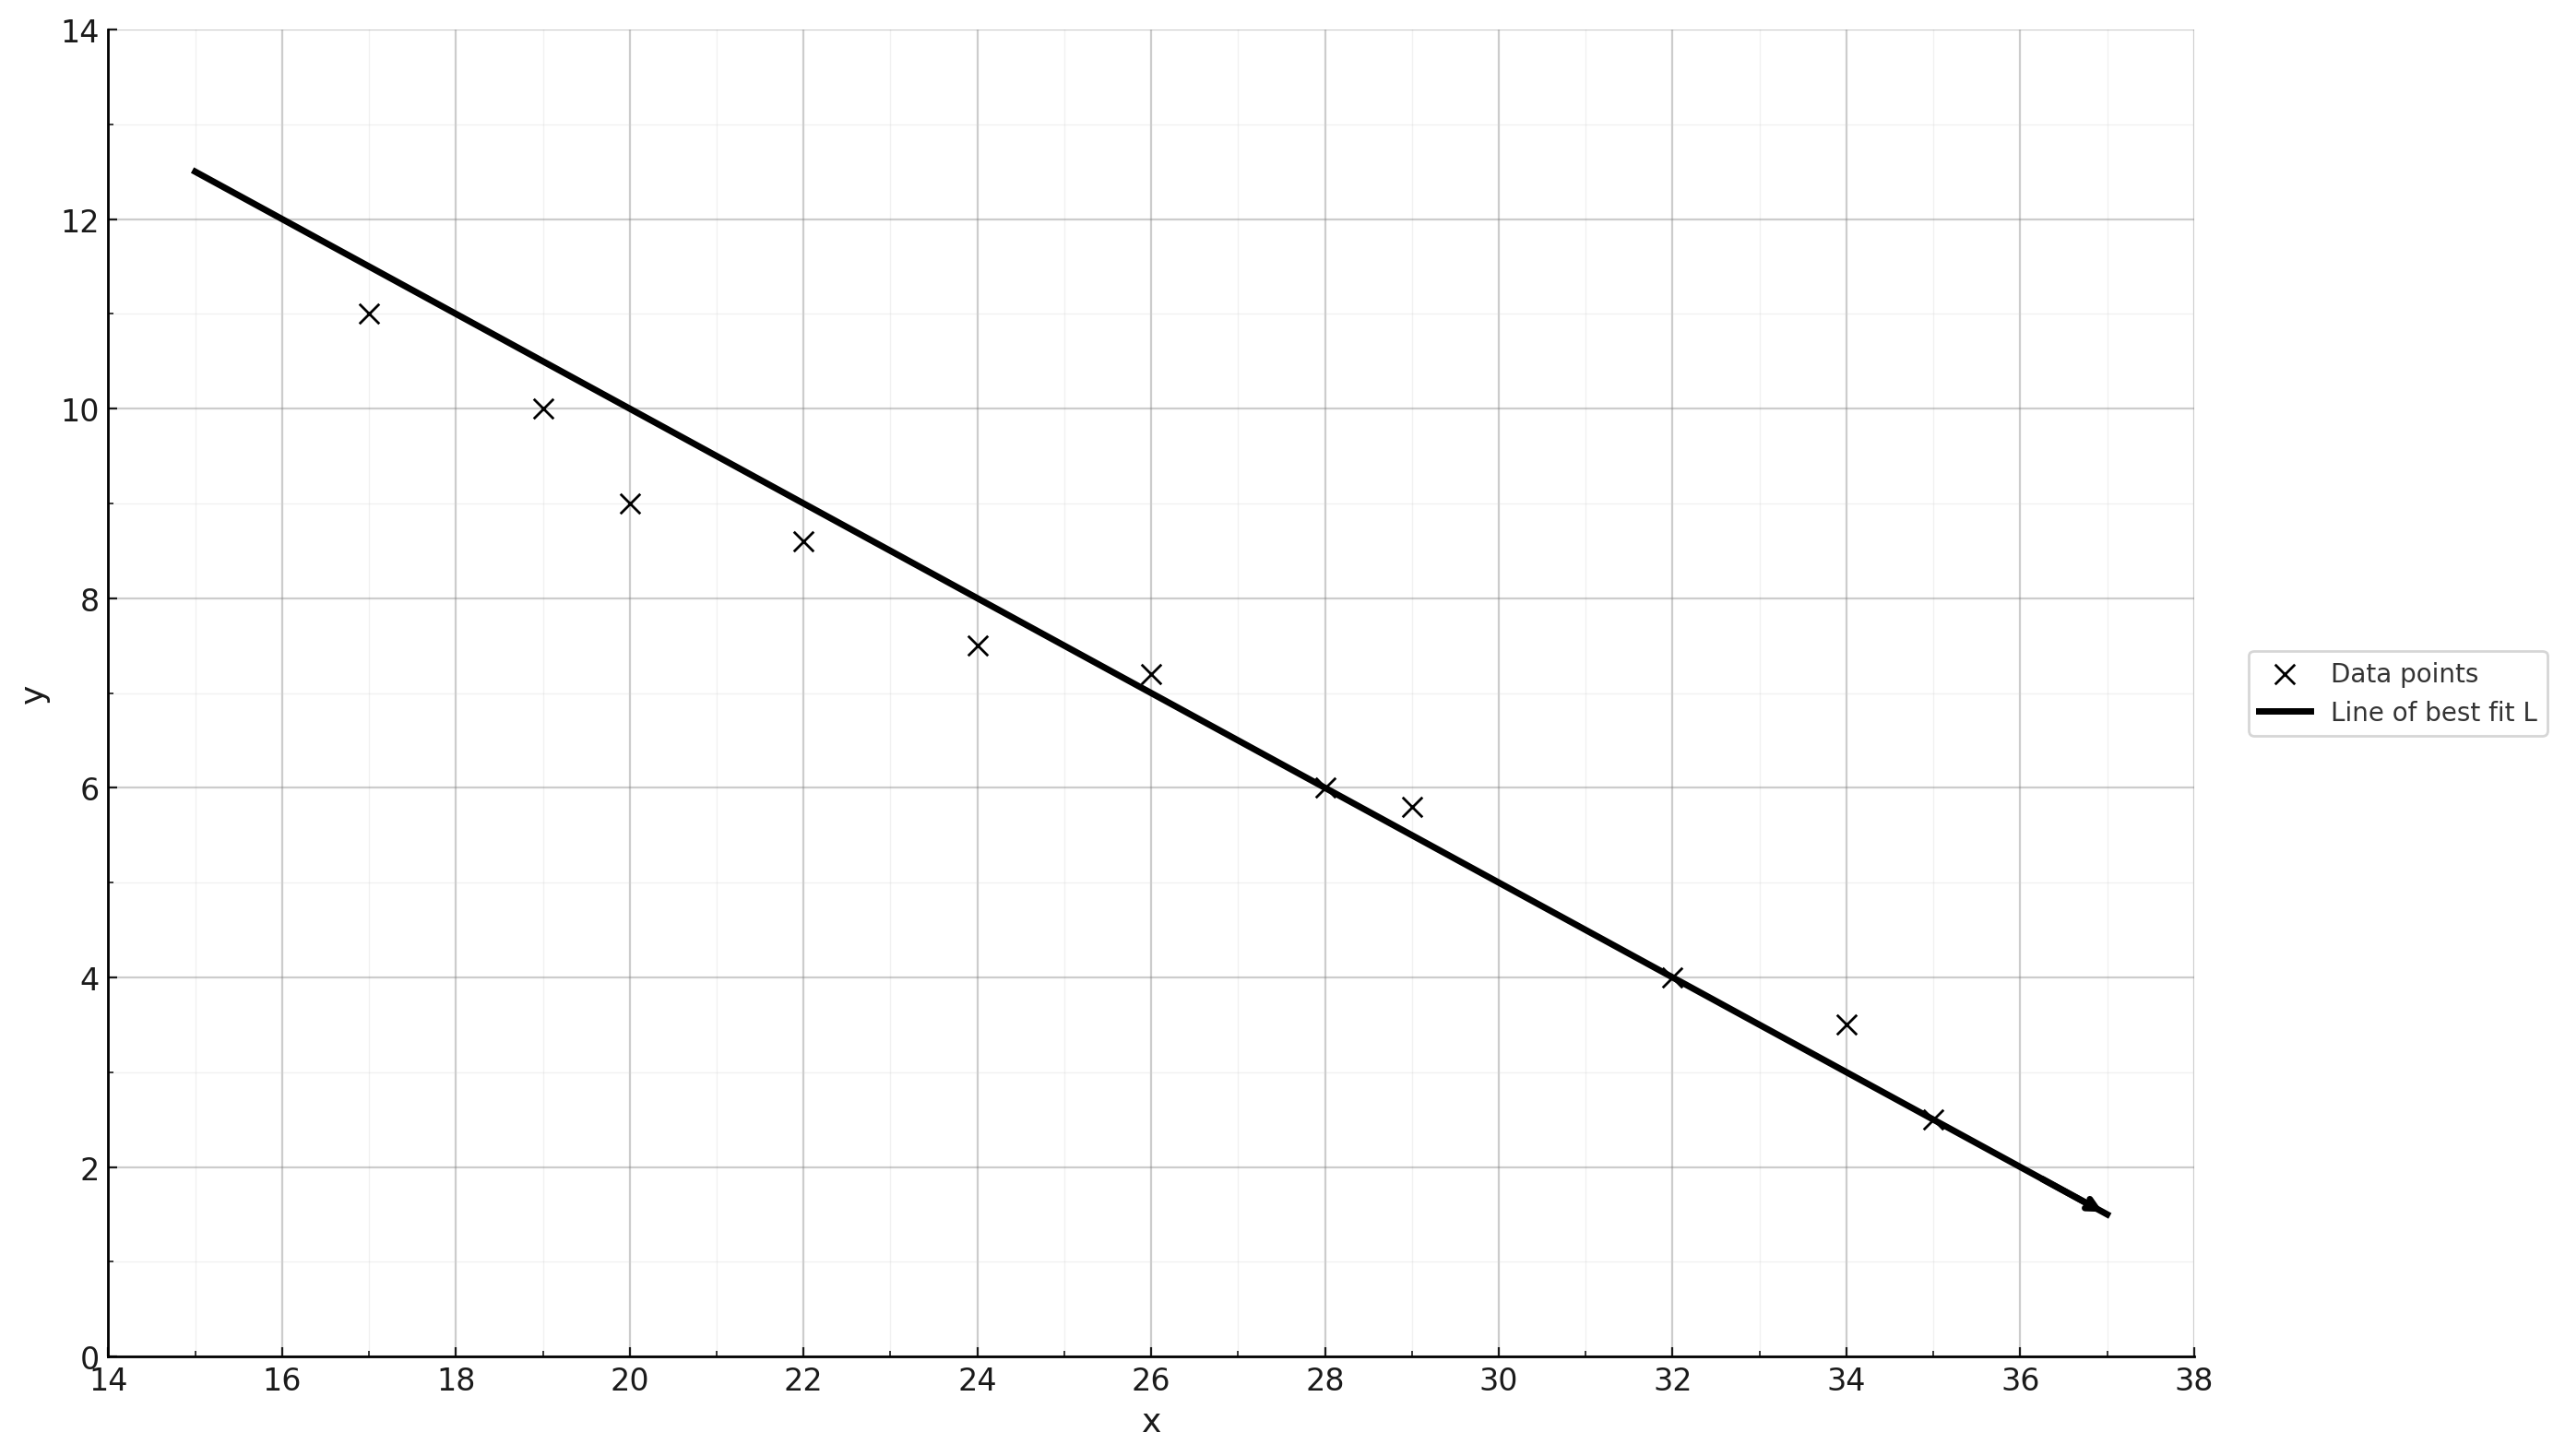
The scatterplot shows paired data (x, y) and a line of best fit. At \(\mathrm{x = 27}\), which of the following is closest to the y-value predicted by the line of best fit?
5.7
6.5
7.3
8.1
1. TRANSLATE the problem information
The question asks for the y-value predicted by the line of best fit at \(\mathrm{x = 27}\). This means:
- We need to read from the line (the solid line), not from the scatter points (the X marks)
- We need to find or create an equation for this line
- Then evaluate that equation at \(\mathrm{x = 27}\)
2. INFER the best approach
To find the predicted value at \(\mathrm{x = 27}\), we need the equation of the line. Since we have the graph, we can:
- Identify two clear points on the line of best fit
- Use these points to find the slope
- Write the equation using point-slope form
- Evaluate at \(\mathrm{x = 27}\)
Key insight: The line of best fit shows the general trend and gives predictions - we ignore the individual scatter points for this calculation.
3. TRANSLATE coordinates from the graph
Looking at the line of best fit carefully:
- On the left side, the line passes through approximately \(\mathrm{(16, 12)}\)
- On the right side, the line passes through approximately \(\mathrm{(36, 2)}\)
These two points are clearly on or very close to the line and are far enough apart to give an accurate slope.
4. SIMPLIFY to find the slope
Using the slope formula with our two points \(\mathrm{(16, 12)}\) and \(\mathrm{(36, 2)}\):
\(\mathrm{m = \frac{y_2 - y_1}{x_2 - x_1}}\)
\(\mathrm{m = \frac{2 - 12}{36 - 16}}\)
\(\mathrm{m = \frac{-10}{20}}\)
\(\mathrm{m = -0.5}\)
The negative slope makes sense - the line is going downward from left to right.
5. SIMPLIFY to write the equation
Using point-slope form with point \(\mathrm{(16, 12)}\) and slope \(\mathrm{m = -0.5}\):
\(\mathrm{y - 12 = -0.5(x - 16)}\)
This can be rearranged, but it's actually easiest to use as-is for our calculation.
6. SIMPLIFY to find y when x = 27
Substitute \(\mathrm{x = 27}\) into our equation:
\(\mathrm{y - 12 = -0.5(27 - 16)}\)
\(\mathrm{y - 12 = -0.5(11)}\)
\(\mathrm{y - 12 = -5.5}\)
\(\mathrm{y = 12 - 5.5}\)
\(\mathrm{y = 6.5}\)
Answer: (B) 6.5
Why Students Usually Falter on This Problem
Most Common Error Path:
Weak TRANSLATE skill: Reading coordinates inaccurately from the graph
Students may misread the points on the line of best fit, perhaps identifying points like \(\mathrm{(15, 11)}\) and \(\mathrm{(35, 3)}\) instead of the more accurate \(\mathrm{(16, 12)}\) and \(\mathrm{(36, 2)}\). This would give:
- Slope: \(\mathrm{m = \frac{3 - 11}{35 - 15} = \frac{-8}{20} = -0.4}\)
- Using \(\mathrm{(15, 11)}\): \(\mathrm{y = 11 - 0.4(27 - 15) = 11 - 0.4(12) = 11 - 4.8 = 6.2}\)
While 6.2 is close to the correct answer, it might cause confusion between choices, or if the coordinates are read even less accurately, could lead to selecting Choice (A) (5.7) or Choice (C) (7.3).
Second Most Common Error:
Conceptual confusion: Trying to use the scatter points instead of the line of best fit
Some students might look for a data point near \(\mathrm{x = 27}\) or try to average nearby scatter points instead of using the line of best fit. Looking at the graph, there's a scatter point near \(\mathrm{x = 28}\) that appears to be at \(\mathrm{y \approx 6}\). Students might interpolate incorrectly or get confused about which points to use. This leads to confusion and guessing, potentially selecting Choice (A) (5.7) as it's closer to the nearby scatter point.
Third Error Path:
Poor SIMPLIFY execution: Making arithmetic errors in multi-step calculations
Even with the correct slope \(\mathrm{(-0.5)}\) and correct point \(\mathrm{(16, 12)}\), students can make errors:
- Calculating \(\mathrm{27 - 16 = 10}\) instead of 11
- Then: \(\mathrm{y = 12 - 0.5(10) = 12 - 5 = 7}\)
This may lead them to select Choice (C) (7.3)
Or making sign errors when handling the negative slope, potentially getting \(\mathrm{y = 12 + 5.5 = 17.5}\), which doesn't match any choice and causes them to abandon the systematic solution and guess.
The Bottom Line:
This problem tests whether students understand that a line of best fit is used for predictions (not the scatter points themselves), and whether they can accurately read a graph, set up a linear equation, and execute multi-step calculations without arithmetic errors. The close spacing of answer choices means small errors in any step can lead to wrong answers.
5.7
6.5
7.3
8.1