Which of the following equations is the most appropriate linear model for the data shown in the scatterplot?
GMAT Problem-Solving and Data Analysis : (PS_DA) Questions
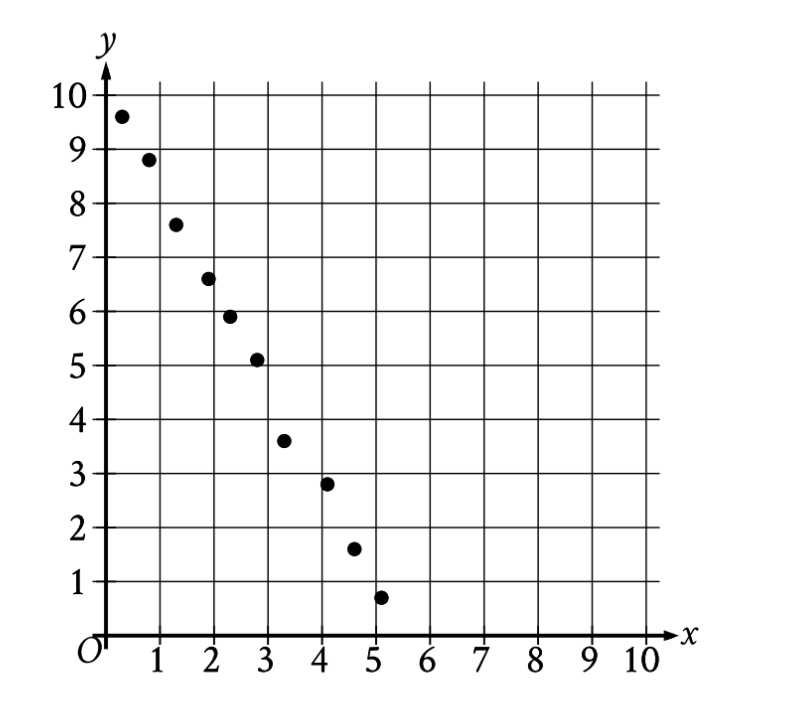
Which of the following equations is the most appropriate linear model for the data shown in the scatterplot?
1. TRANSLATE the scatterplot information
- TRANSLATE what you see in the graph:
- Multiple data points plotted
- Points appear to follow a general linear pattern
- Need to describe this pattern with an equation
2. INFER the slope direction from the visual trend
- INFER by asking: "As I move from left to right, what happens to the y-values?"
- Starting at \(\mathrm{x = 0.5}\), \(\mathrm{y ≈ 9.6}\)
- Moving right to \(\mathrm{x = 5.5}\), \(\mathrm{y ≈ 0.7}\)
- The y-values are decreasing as x increases
- This tells us: The slope must be negative
Key insight: A downward trend (upper left to lower right) = negative slope
3. INFER the y-intercept location
- INFER by asking: "If I extended this pattern to where x = 0, where would y be?"
- The leftmost point shown is around \(\mathrm{(0.5, 9.6)}\)
- The pattern suggests if we go slightly left to \(\mathrm{x = 0}\), y would be slightly higher
- Estimate: y-intercept is around \(\mathrm{y = 10}\)
- This tells us: The y-intercept must be positive (around +10, not -10)
4. APPLY CONSTRAINTS to match equation form
- Linear equations in form \(\mathrm{y = mx + b}\) have:
- \(\mathrm{m}\) = slope (first coefficient with x)
- \(\mathrm{b}\) = y-intercept (constant term)
- We need:
- \(\mathrm{m < 0}\) (negative)
- \(\mathrm{b > 0}\) (positive)
5. INFER which choice fits both criteria
Examine each choice:
- Choice A: \(\mathrm{y = -1.9x - 10.1}\)
- Slope: \(\mathrm{-1.9}\) ✓ (negative)
- Y-intercept: \(\mathrm{-10.1}\) ✗ (negative, not positive)
- Choice B: \(\mathrm{y = -1.9x + 10.1}\)
- Slope: \(\mathrm{-1.9}\) ✓ (negative)
- Y-intercept: \(\mathrm{+10.1}\) ✓ (positive)
- Choice C: \(\mathrm{y = 1.9x - 10.1}\)
- Slope: \(\mathrm{1.9}\) ✗ (positive, not negative)
- Y-intercept: \(\mathrm{-10.1}\) ✗ (negative, not positive)
- Choice D: \(\mathrm{y = 1.9x + 10.1}\)
- Slope: \(\mathrm{1.9}\) ✗ (positive, not negative)
- Y-intercept: \(\mathrm{+10.1}\) ✓ (positive)
Only Choice B satisfies both requirements.
Answer: B. \(\mathrm{y = -1.9x + 10.1}\)
Why Students Usually Falter on This Problem
Most Common Error Path:
Weak INFER skill: Students misinterpret which sign corresponds to which parameter. They might correctly identify that "something should be negative and something should be positive," but then confuse which one is which.
For example, they might think:
- "The trend goes down, so the y-intercept should be negative" (incorrect reasoning)
- Or: "The points start high at 10, so the slope should be positive" (incorrect reasoning)
This confusion might lead them to select Choice A (\(\mathrm{y = -1.9x - 10.1}\)) if they focus only on the negative slope but miss that the y-intercept sign is wrong, or Choice D (\(\mathrm{y = 1.9x + 10.1}\)) if they focus only on the positive y-intercept but miss that the slope sign is wrong.
Second Most Common Error:
Conceptual gap in slope interpretation: Students may not firmly understand that "downward trend = negative slope." They might see the points going downward and think "the numbers are getting smaller" but fail to connect this to "negative slope."
They might randomly guess between choices, or specifically select Choice C (\(\mathrm{y = 1.9x - 10.1}\)) or Choice D (\(\mathrm{y = 1.9x + 10.1}\)) because they see "1.9" matches the rate of change they observe (about 2 units down for every 1 unit across) without recognizing that this rate needs a negative sign.
The Bottom Line:
This problem requires strong visual-to-algebraic translation skills. Students must INFER two separate characteristics from the graph (slope direction and y-intercept location) and then APPLY both constraints simultaneously when selecting an answer. Missing either piece, or confusing which parameter has which sign, leads directly to a wrong answer choice.