The graph of the function f, where \(\mathrm{y = f(x)}\), gives the total cost y, in dollars, for a certain...
GMAT Algebra : (Alg) Questions
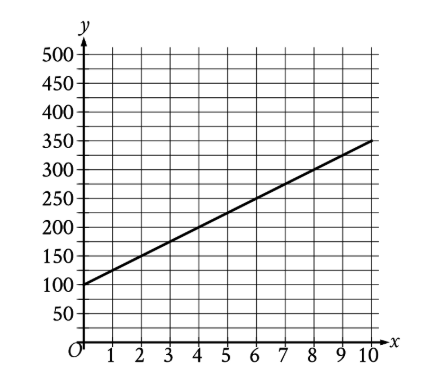
The graph of the function f, where \(\mathrm{y = f(x)}\), gives the total cost y, in dollars, for a certain video game system and x games. What is the best interpretation of the slope of the graph in this context?
[Graph shows a linear function with y-axis labeled from 0 to 500 and x-axis from 0 to 10, with a line starting at approximately \(\mathrm{(0,100)}\) and passing through points that show an upward trend]
Each game costs \(\$25\).
The video game system costs \(\$100\).
The video game system costs \(\$25\).
Each game costs \(\$100\).
1. TRANSLATE the problem information
Looking at the graph and problem statement:
- Given information:
- y = total cost in dollars for system and games
- x = number of games
- The graph shows a linear relationship
- We need to interpret what the slope means
- What we need to find: The meaning of the slope in this real-world context
2. TRANSLATE coordinates from the graph
To find slope, we need two clear points on the line:
- Point 1: (0, 100)
- When there are 0 games, the total cost is $100
- This makes sense—it's the cost of just the video game system
- Point 2: (1, 125)
- When there is 1 game, the total cost is $125
3. SIMPLIFY to calculate the slope
Using the slope formula:
\(\mathrm{Slope} = \frac{\mathrm{change~in~y}}{\mathrm{change~in~x}} = \frac{\mathrm{y_2 - y_1}}{\mathrm{x_2 - x_1}}\)
\(\mathrm{Slope} = \frac{125 - 100}{1 - 0}\)
\(\mathrm{Slope} = \frac{25}{1}\)
\(\mathrm{Slope} = 25\)
4. INFER what the slope means in context
Here's the key insight:
- \(\mathrm{Slope} = \frac{\mathrm{change~in~total~cost}}{\mathrm{change~in~number~of~games}}\)
- This tells us: how much the total cost increases for each additional game
- In other words: the cost per game
Since the slope is 25, each game costs $25.
Check against answer choices:
- Choice A: 'Each game costs $25' ✓ This matches our interpretation
- Choice B: 'The video game system costs $100' - This is the y-intercept, not the slope
- Choice C: 'The video game system costs $25' - Wrong value for the system
- Choice D: 'Each game costs $100' - Wrong value for the slope
Answer: A. Each game costs $25.
Why Students Usually Falter on This Problem
Most Common Error Path:
Conceptual confusion between slope and y-intercept:
Students often mix up what slope and y-intercept represent. They see that the line starts at 100 on the y-axis and think 'the question asks about the slope, and I see 100 on the graph, so the slope must relate to $100.'
This confusion leads them to select Choice B (The video game system costs $100) or Choice D (Each game costs $100), interpreting features of the graph incorrectly.
Second Most Common Error:
Weak INFER skill—not connecting slope to rate of change:
Some students can calculate the slope correctly (getting 25) but don't understand what it means in context. They might think:
- '25 is smaller than 100, so 25 must be some minor cost'
- 'The system is the main purchase, so slope must relate to the system'
This leads them to select Choice C (The video game system costs $25), applying the correct calculation to the wrong interpretation.
The Bottom Line:
The key challenge is understanding that slope always represents rate of change. In this context, slope = (change in total cost)/(change in games) = cost per game. The y-intercept (where the line crosses the y-axis when x = 0) represents the initial fixed cost—the video game system itself. Many students confuse these two fundamental features of linear graphs.
Each game costs \(\$25\).
The video game system costs \(\$100\).
The video game system costs \(\$25\).
Each game costs \(\$100\).