A group of students voted on five after-school activities. The bar graph shows the number of students who voted for...
GMAT Problem-Solving and Data Analysis : (PS_DA) Questions
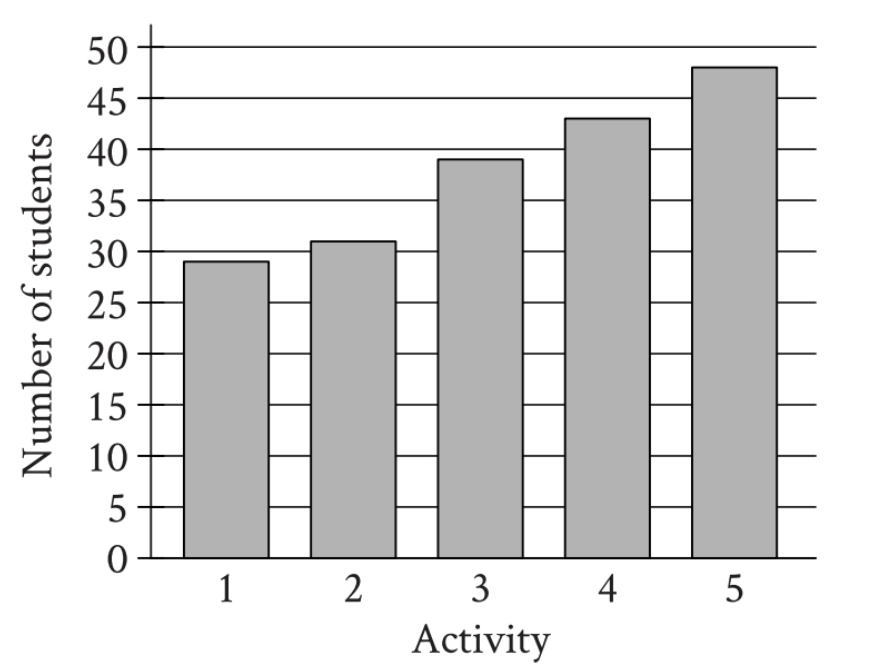
A group of students voted on five after-school activities. The bar graph shows the number of students who voted for each of the five activities. How many students chose activity 3?
25
39
48
50
1. TRANSLATE the graph structure
- Understand what the graph shows:
- The x-axis (horizontal) shows the five different activities (numbered 1 through 5)
- The y-axis (vertical) shows the number of students (scale from 0 to 50)
- Each bar's height represents how many students voted for that activity
2. TRANSLATE the specific information for activity 3
- Locate activity 3 on the x-axis (it's the middle bar)
- Read the bar height:
- Look at where the top of the bar aligns with the y-axis
- The bar clearly rises above the 35 gridline
- The bar clearly stops below the 40 gridline
- Therefore, the number of students is between 35 and 40
3. INFER which answer choice fits the observed range
- Given that the value must be between 35 and 40, check each choice:
- Choice A (25): Too low - this is below 35
- Choice B (39): Perfect - this is between 35 and 40
- Choice C (48): Too high - this is above 40 (and would align with activity 5's bar)
- Choice D (50): Too high - this would be at the top of the scale
- Only one answer choice falls in the correct range
Answer: B. 39
Why Students Usually Falter on This Problem
Most Common Error Path:
Weak TRANSLATE skill: Students misidentify which bar represents activity 3, reading from the wrong bar instead.
For example, if a student reads the height of activity 1's bar (approximately 30) or activity 5's bar (approximately 48), they would get confused because:
- 30 doesn't match any answer choice exactly (though they might round to 25)
- 48 matches Choice C exactly
This may lead them to select Choice C (48) if they accidentally read activity 5's bar, or to guess randomly if they read activity 1's bar.
Second Most Common Error:
Weak TRANSLATE skill: Students misread the scale or incorrectly estimate between gridlines.
Some students might look at activity 3's bar but misinterpret where it falls on the y-axis scale. They might:
- Focus on the wrong gridline as a reference point
- Fail to notice the bar is clearly between 35 and 40
- Guess at what seems like a "reasonable" number without carefully checking the scale
This leads to confusion and potential guessing, or they might select Choice A (25) if they significantly underestimate the bar height.
The Bottom Line:
This problem tests careful visual reading and attention to detail. The key challenge is precisely matching the bar height to the y-axis scale, then using the answer choices to confirm which value makes sense. Students must slow down and carefully identify both the correct bar AND its height relative to the gridlines.
25
39
48
50