The number of acres of useful timberland in 13 counties in California is summarized in the box plot above. Which...
GMAT Problem-Solving and Data Analysis : (PS_DA) Questions
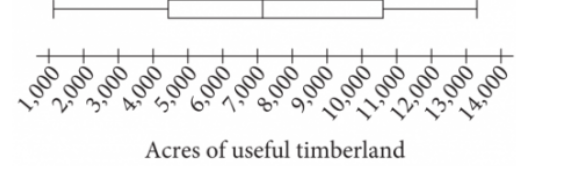
The number of acres of useful timberland in 13 counties in California is summarized in the box plot above. Which of the following is closest to the median number of acres?
4,399
7,067
8,831
10,595
1. TRANSLATE the box plot structure
The key to this problem is understanding what each part of a box plot represents:
- The box (rectangle) shows the middle 50% of the data
- The left edge of the box = First Quartile (Q1)
- The vertical line INSIDE the box = Median (what we need!)
- The right edge of the box = Third Quartile (Q3)
- The whiskers (lines extending left and right) go to the minimum and maximum
Critical insight: Don't confuse the edges of the box with the median. The median is specifically the line INSIDE the box.
2. TRANSLATE the visual information to locate the median
Looking at the box plot:
- Find the rectangular box (it's roughly between 4,000 and 11,000)
- Inside this box, there's a vertical line segment
- This line is positioned slightly above 7,000 on the horizontal axis
3. INFER which answer choice is closest
The median line appears to be at approximately 7,000 (just a bit more).
Now compare with the answer choices:
- A. 4,399 → This is around 4,500, matching the left edge of the box (Q1), not the median
- B. 7,067 → This is just above 7,000, matching the median line ✓
- C. 8,831 → This is closer to 9,000, between the median and Q3
- D. 10,595 → This is around 10,500, matching the right edge of the box (Q3)
Answer: B. 7,067
Why Students Usually Falter on This Problem
Most Common Error Path:
Weak TRANSLATE skill: Not correctly identifying which line in the box plot represents the median
Students sometimes think the median is represented by:
- The left edge of the box (which is actually Q1), leading them to select Choice A (4,399)
- The right edge of the box (which is actually Q3), leading them to select Choice D (10,595)
This happens because they remember that box plots show quartiles and medians, but don't recall the specific positions—that the median is the line INSIDE the box, not one of its edges.
Second Most Common Error:
Inadequate TRANSLATE execution: Misreading the scale on the horizontal axis
Students might:
- Miscount the grid lines or intervals on the x-axis
- Estimate the median position incorrectly (reading it as 8,000-9,000 instead of ~7,000)
This may lead them to select Choice C (8,831) if they overestimate where the median line falls, or causes confusion and guessing if they can't accurately read the scale.
The Bottom Line:
This problem tests whether students can interpret the visual representation of data in a box plot. The challenge isn't calculation—it's knowing what each part of the box plot represents and accurately reading values from a graph. Many students struggle because they confuse the structural elements of a box plot (edges vs. internal lines) or lack practice reading precise values from visual displays.
4,399
7,067
8,831
10,595