The two box plots show the distribution of number of books read over the summer by the students in two...
GMAT Problem-Solving and Data Analysis : (PS_DA) Questions
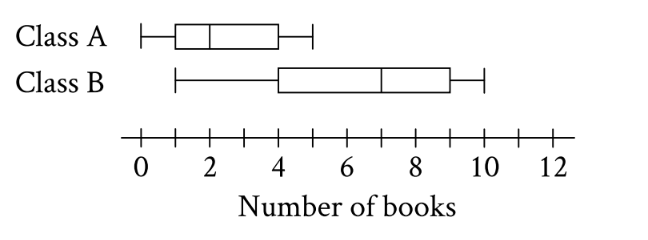
The two box plots show the distribution of number of books read over the summer by the students in two different English classes. What is the positive difference between the ranges of number of books read over the summer for the two classes?
1. TRANSLATE the box plot structure
The key to reading a box plot is understanding what each element represents:
- The leftmost whisker endpoint = minimum value in the data
- The rightmost whisker endpoint = maximum value in the data
- The box edges and middle line show quartiles, but we don't need those for finding range
Important: Don't confuse the box edges with the whiskers! The whiskers extend beyond the box to show the extreme values.
2. TRANSLATE Class A's data from the graph
Looking at Class A's box plot:
- Leftmost whisker endpoint: 0 books
- Rightmost whisker endpoint: 5 books
3. Calculate Class A's range
Since range = maximum - minimum:
- Range for Class A = \(\mathrm{5 - 0 = 5}\) books
4. TRANSLATE Class B's data from the graph
Looking at Class B's box plot:
- Leftmost whisker endpoint: 1 book
- Rightmost whisker endpoint: 10 books
5. Calculate Class B's range
- Range for Class B = \(\mathrm{10 - 1 = 9}\) books
6. SIMPLIFY to find the positive difference
The problem asks for the positive difference between the two ranges. This means we subtract the smaller range from the larger range:
- Class B range (9) - Class A range (5) = \(\mathrm{4}\)
Answer: 4
Why Students Usually Falter on This Problem
Most Common Error Path:
TRANSLATE error - Misreading the box plot structure: Students often confuse the edges of the box with the minimum and maximum values. The box edges actually represent Q1 (first quartile) and Q3 (third quartile), not the extreme values.
For example, if a student reads Class A's box as having:
- Minimum = 2 (left edge of box, actually Q1)
- Maximum = 4 (right edge of box, actually Q3)
They would calculate Range = \(\mathrm{4 - 2 = 2}\)
Then for Class B:
- Minimum = 4 (left edge of box)
- Maximum = 8 (right edge of box)
- Range = \(\mathrm{8 - 4 = 4}\)
This would give a positive difference of \(\mathrm{4 - 2 = 2}\) instead of the correct answer of 4.
This leads to confusion when their answer doesn't match the expected result, causing them to second-guess or guess randomly.
Second Most Common Error:
SIMPLIFY error - Subtracting in the wrong order: Some students might correctly find both ranges (5 and 9) but then calculate the difference as \(\mathrm{5 - 9 = -4}\) and report "-4" as their answer, not recognizing that "positive difference" requires taking the absolute value or subtracting smaller from larger.
Since the problem specifically asks for the "positive difference," the answer must be positive: \(\mathrm{|5 - 9| = |-4| = 4}\) or simply \(\mathrm{9 - 5 = 4}\).
The Bottom Line:
This problem tests whether students can correctly interpret the visual representation of a box plot. The critical skill is recognizing that the whisker endpoints (not the box edges) represent the minimum and maximum values needed to calculate range. Many students haven't internalized the complete structure of a box plot and focus only on the box itself.