The bar graph shows the number of each type of monkey in a sanctuary.[Bar graph showing Number of monkeys (y-axis,...
GMAT Problem-Solving and Data Analysis : (PS_DA) Questions
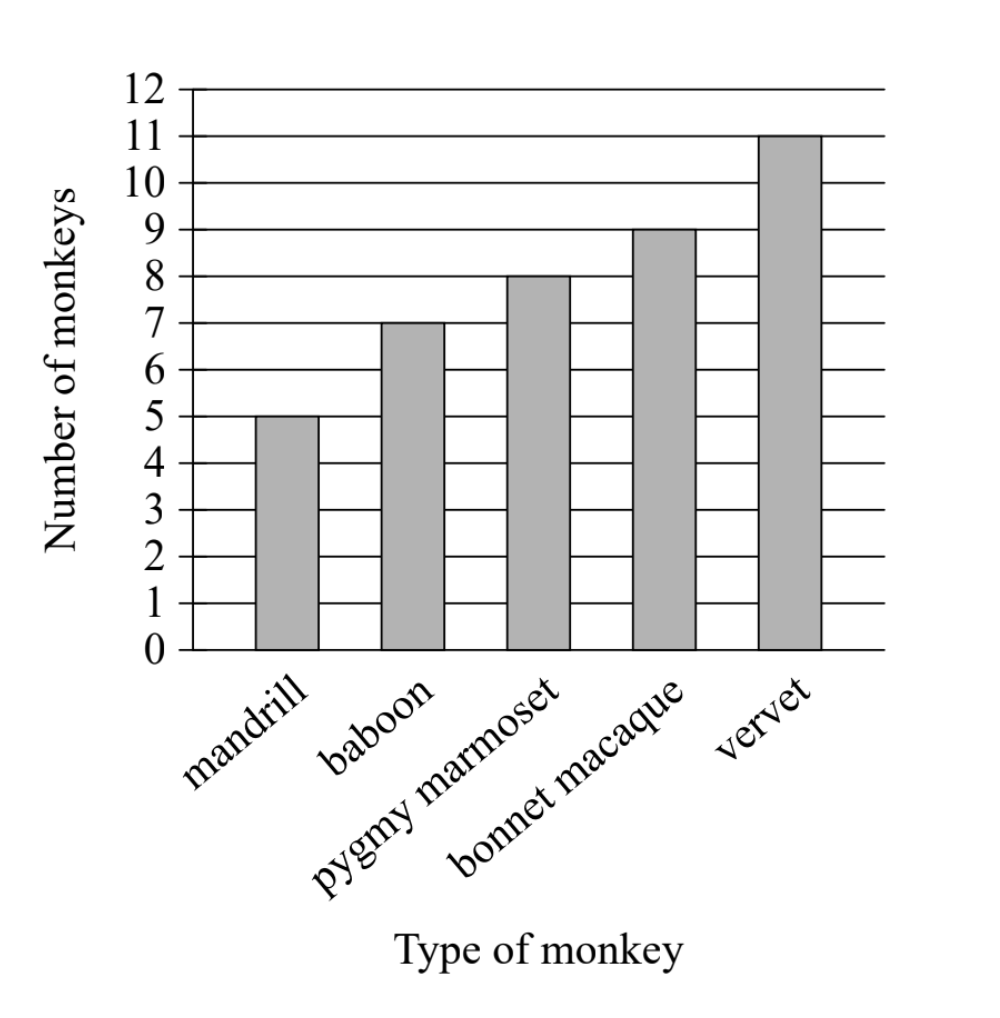
The bar graph shows the number of each type of monkey in a sanctuary.
[Bar graph showing Number of monkeys (y-axis, 0-12) vs Type of monkey (x-axis: mandrill, baboon, pygmy marmoset, bonnet macaque, vervet). The bars show: mandrill = 5, baboon = 7, pygmy marmoset = 8, bonnet macaque = 9, vervet = 11]
How many more vervets are in this sanctuary than mandrills?
11
6
5
3
1. TRANSLATE the information from the bar graph
First, locate the two types of monkeys mentioned in the question:
- Mandrill bar: The height reaches 5 on the y-axis
- There are 5 mandrills in the sanctuary
- Vervet bar: The height reaches 11 on the y-axis
- There are 11 vervets in the sanctuary
2. TRANSLATE what the question is asking
The phrase "how many more vervets...than mandrills" is asking for:
- The difference between these two quantities
- This means we need to subtract the smaller number from the larger number
- Mathematical operation: vervets - mandrills = ?
3. Calculate the difference
Now perform the subtraction:
- \(11 - 5 = 6\)
There are 6 more vervets than mandrills in the sanctuary.
Answer: B. 6
Why Students Usually Falter on This Problem
Most Common Error Path:
Weak TRANSLATE skill - Incomplete interpretation of comparison language: Students read the graph correctly but don't understand that "how many more" requires finding the difference between two values. They might think the question is asking for just one of the values mentioned.
If they just identify the number of vervets, they select Choice A (11).
If they just identify the number of mandrills, they select Choice C (5).
Second Most Common Error:
Poor TRANSLATE execution - Misreading the bar graph: Students may:
- Confuse which bar represents which animal (mixing up mandrill and vervet)
- Miscount the grid lines on the y-axis
- Read the value incorrectly
This could lead to calculation errors that result in Choice D (3) or cause confusion and guessing.
The Bottom Line:
This problem requires careful attention to two distinct TRANSLATE skills: accurately reading specific data points from a visual representation AND understanding the mathematical meaning of comparison words. Students who rush through may only complete half the task—reading values without performing the necessary operation, or they may misidentify which bars to compare.
11
6
5
3