The bar graph shows the distribution of the number of walnuts per container for 20 containers at a grocery store.Bar...
GMAT Problem-Solving and Data Analysis : (PS_DA) Questions
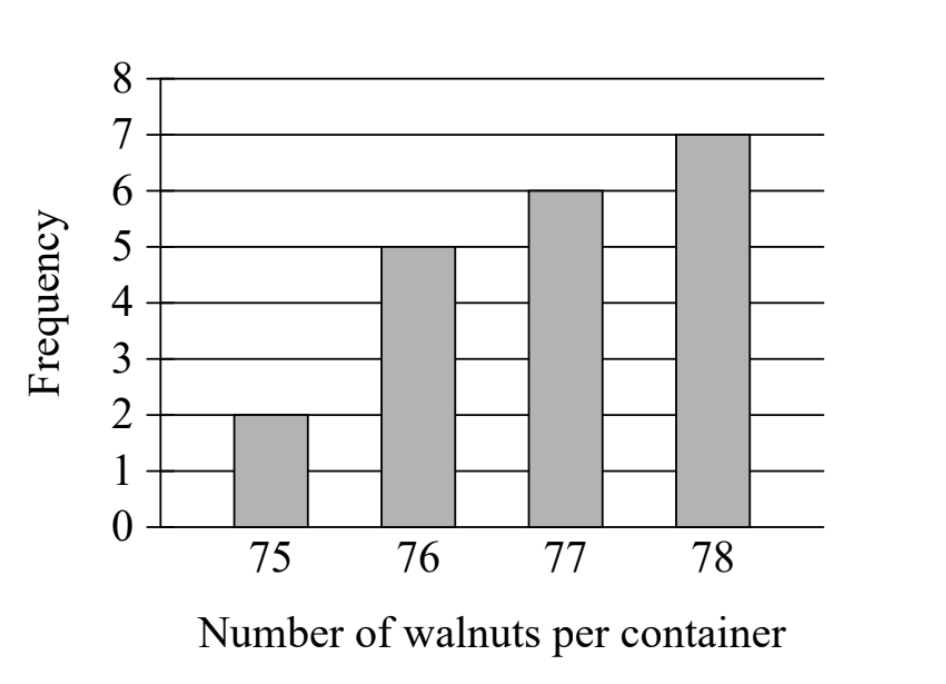
The bar graph shows the distribution of the number of walnuts per container for 20 containers at a grocery store.
Bar graph showing Frequency (y-axis, 0-8) vs Number of walnuts per container (x-axis: 75, 76, 77, 78). The bars show:
- 75 walnuts = 2 containers
- 76 walnuts = 5 containers
- 77 walnuts = 6 containers
- 78 walnuts = 7 containers
How many of these containers of walnuts contain exactly 78 walnuts?
2
7
20
78
1. TRANSLATE the graph structure
First, let's understand what this bar graph is showing us:
- X-axis (horizontal): "Number of walnuts per container" - This shows different counts of walnuts (75, 76, 77, 78)
- Y-axis (vertical): "Frequency" - This tells us how many containers have each walnut count
- The bars: Each bar's height tells us how many containers contain that specific number of walnuts
2. INFER what the question is asking
The question asks: "How many of these containers contain exactly 78 walnuts?"
- We're looking for a COUNT of containers (how many containers)
- This count is represented by the HEIGHT of the bar, not the number on the x-axis
- We need to find the bar at \(x = 78\) and read its height
3. TRANSLATE the visual information to get our answer
- Locate the bar positioned at "78" on the x-axis
- Read up to the top of that bar
- The bar reaches to 7 on the y-axis (Frequency)
- This means 7 containers contain exactly 78 walnuts
Answer: B. 7
Why Students Usually Falter on This Problem
Most Common Error Path:
Weak TRANSLATE skill - Confusing x-axis and y-axis values:
Students often confuse what each axis represents. When they see "78 walnuts" in the question, they might simply select 78 as the answer, not realizing they need to read the HEIGHT of the bar (the frequency), not the position on the x-axis.
This leads them to select Choice D (78).
Second Most Common Error:
Poor INFER reasoning - Misunderstanding "how many":
Some students see "how many containers" and think about the total number of containers in the entire dataset rather than focusing on just the containers with 78 walnuts. Adding up all the bar heights (\(2 + 5 + 6 + 7 = 20\)), they might report the total.
This leads them to select Choice C (20).
The Bottom Line:
This problem tests whether students can correctly interpret a bar graph by distinguishing between the category label (x-axis: number of walnuts) and the frequency count (y-axis: number of containers). The key is recognizing that "how many containers" always refers to the bar's HEIGHT, not its position or any other value on the graph.
2
7
20
78