A sociology student is reading an essay on the median age of first marriage in Western countries throughout the twentieth...
GMAT Information and Ideas : (Ideas) Questions
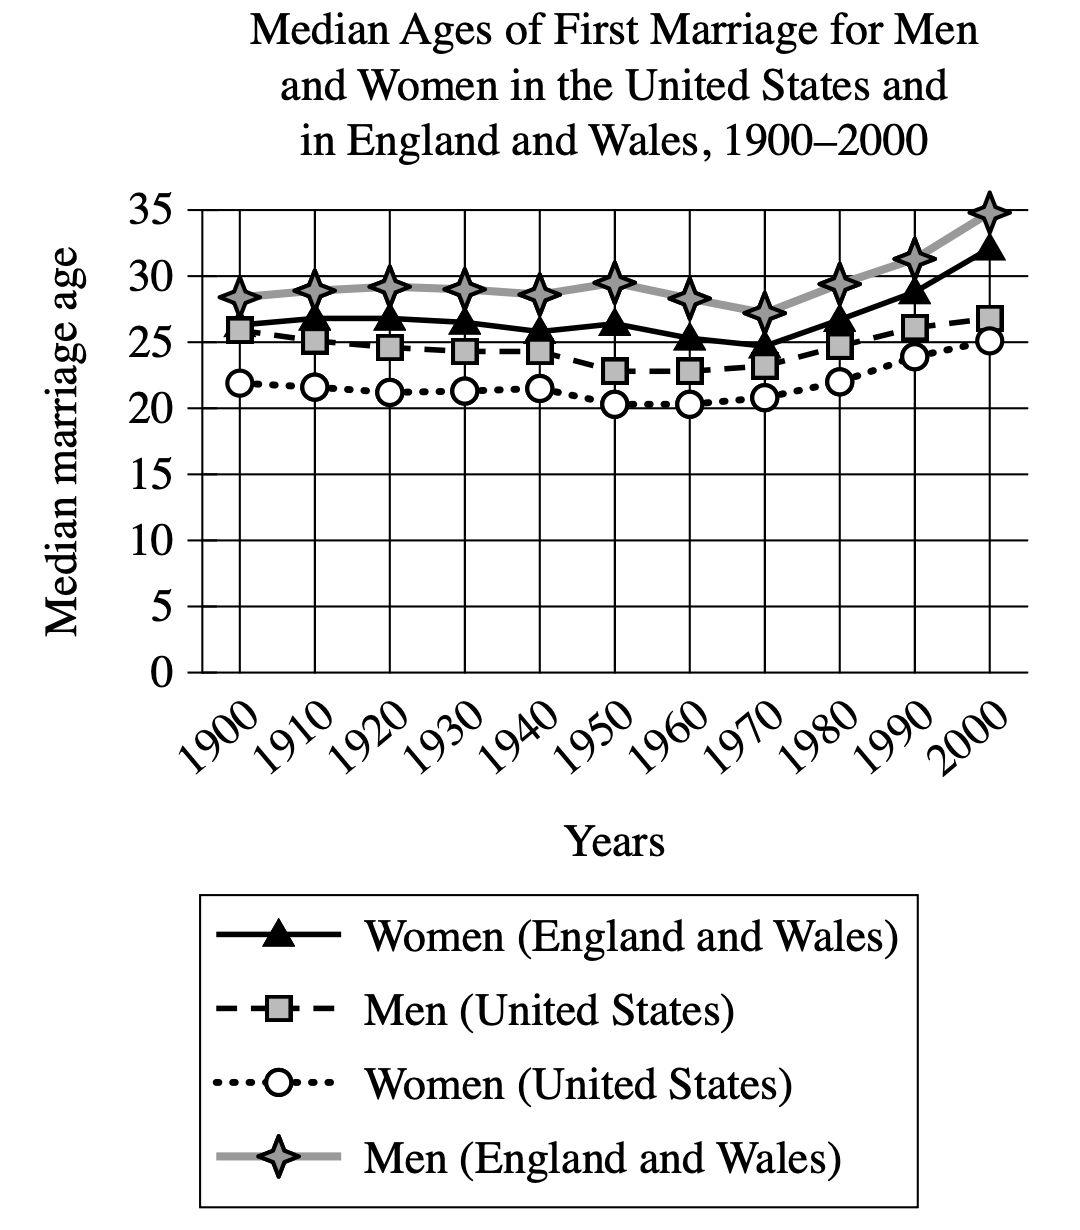
A sociology student is reading an essay on the median age of first marriage in Western countries throughout the twentieth century. The author of the essay cites factors common to these countries that the author believes caused an increase in the median age of first marriage, such as new technologies that shortened the time needed for domestic chores, making two-person households less necessary and living alone more viable. The student asserts that beyond these factors there must be additional ones specific to particular Western countries that influenced the increase of age at first marriage.
Which choice most effectively uses data from the graph that support the student's assertion?
Between 1970 and 2000, the median age of first marriage rose more sharply for men in England and Wales than it did for men in the United States.
In England and Wales, the median age of first marriage was consistently higher for men than for women between 1900 and 2000, but this was not always the case in the United States.
The median age of first marriage for men in England and Wales was lower in 1970 than in 1950 or 1990.
Between 1900 and 2000, the median age of first marriage for women in England and Wales was consistently higher than for women in the United States, as was the case for men.
Step 1: Decode and Map All Source Material
Part A: Passage Analysis Table
| Text from Passage | Analysis |
|---|---|
| 'A sociology student is reading an essay on the median age of first marriage in Western countries throughout the twentieth century.' |
|
| 'The author of the essay cites factors common to these countries that the author believes caused an increase in the median age of first marriage, such as new technologies that shortened the time needed for domestic chores, making two-person households less necessary and living alone more viable.' |
|
| 'The student asserts that beyond these factors there must be additional ones specific to particular Western countries that influenced the increase of age at first marriage.' |
|
Visual Data Analysis:
Visual Type & Title: Line graph - 'Median Ages of First Marriage for Men and Women in the United States and in England and Wales, 1900-2000'
What It Shows: (Note format)
- Y-axis: Marriage age (0-35 years)
- X-axis: Years (1900-2000, 10-year intervals)
- 4 lines: US men (dashed squares), US women (dotted circles), England/Wales men (stars), England/Wales women (triangles)
- Shows median 1st marriage age trends across century
Key Observations: (Note format)
- 1900-1940: All groups approximately 20-27 years, relatively stable
- 1940-1970: Slight variations, general stability
- 1970-2000: Major divergence - England/Wales increases sharply (especially men: approximately 27 to 35), US increases moderately
- England/Wales men show steepest increase post-1970
- Country differences minimal early century, substantial by 2000
Connection to Text: Graph provides specific data on marriage age trends that can reveal whether different countries experienced different patterns (supporting student's assertion about country-specific factors).
Part B: Passage Architecture & Core Elements
Main Point: A student argues that country-specific factors, beyond the common factors cited by an essay author, must have influenced the increase in median marriage age across Western countries.
Argument Flow: The passage presents a scholarly disagreement where an author attributes rising marriage ages to factors common across Western countries (like technology reducing domestic work), but a student contends that additional country-specific factors must also be at play.
Text-Visual Synthesis: The text focuses on the theoretical debate about what caused marriage age increases, while the graph provides concrete data showing actual marriage age patterns in two Western countries (US and England/Wales) across the century.
Step 2: Interpret the Question Precisely
What's being asked? Which answer choice uses graph data to support the student's assertion.
What type of answer do we need? Data from the graph that demonstrates country-specific factors influenced marriage age increases (supporting the student's view that there are additional factors beyond common ones).
Any limiting keywords? 'most effectively uses data from the graph' - we need actual graph evidence, and 'support the student's assertion' - must back up the claim about country-specific factors.
Step 3: Prethink the Answer
- The student's assertion is that there are country-specific factors (beyond common ones) affecting marriage age increases
- To support this, we need graph data showing that the two countries experienced different patterns - this would suggest different factors were at work in each country
- Key elements the correct answer must have:
- Reference specific data from the graph comparing the two countries
- Show a meaningful difference between US and England/Wales patterns
- Demonstrate that the countries didn't follow identical trends (which would contradict country-specific factors)
- From the graph, especially after 1970, England/Wales showed much steeper increases than the US, particularly for men
- This divergence suggests different factors were influencing each country
- The right answer should identify a specific difference between the countries' marriage age trends that indicates country-specific factors were at work
Between 1970 and 2000, the median age of first marriage rose more sharply for men in England and Wales than it did for men in the United States.
✓ Correct
- Points to specific time period (1970-2000) where England/Wales men's marriage age rose more sharply than US men's
- Graph data confirms this: England/Wales men increased from approximately 27 to 35 (steep rise), while US men increased more moderately
- This difference between countries supports student's assertion - if only common factors operated, we'd expect similar patterns
- Different trajectories suggest additional country-specific factors influenced England/Wales
In England and Wales, the median age of first marriage was consistently higher for men than for women between 1900 and 2000, but this was not always the case in the United States.
✗ Incorrect
- Claims consistent gender gap in England/Wales but not always in US
- While this shows some differences, it focuses on gender patterns within countries rather than between countries
- Doesn't directly support the student's assertion about country-specific factors causing the overall marriage age increases
The median age of first marriage for men in England and Wales was lower in 1970 than in 1950 or 1990.
✗ Incorrect
- Describes marriage age for England/Wales men across different decades (lower in 1970 than 1950 or 1990)
- Only discusses one country's pattern over time
- Doesn't provide comparative data between countries to support country-specific factors claim
Between 1900 and 2000, the median age of first marriage for women in England and Wales was consistently higher than for women in the United States, as was the case for men.
✗ Incorrect
- States that England/Wales consistently had higher marriage ages than US for both genders
- While this shows a difference between countries, 'consistently higher' throughout 1900-2000 suggests the same stable difference existed before the factors mentioned by the author
- Doesn't demonstrate the kind of diverging patterns that would support country-specific factors influencing the increases