A student is presenting average monthly rainfall totals in various Puerto Rican cities for a science class. During the presentation,...
GMAT Information and Ideas : (Ideas) Questions
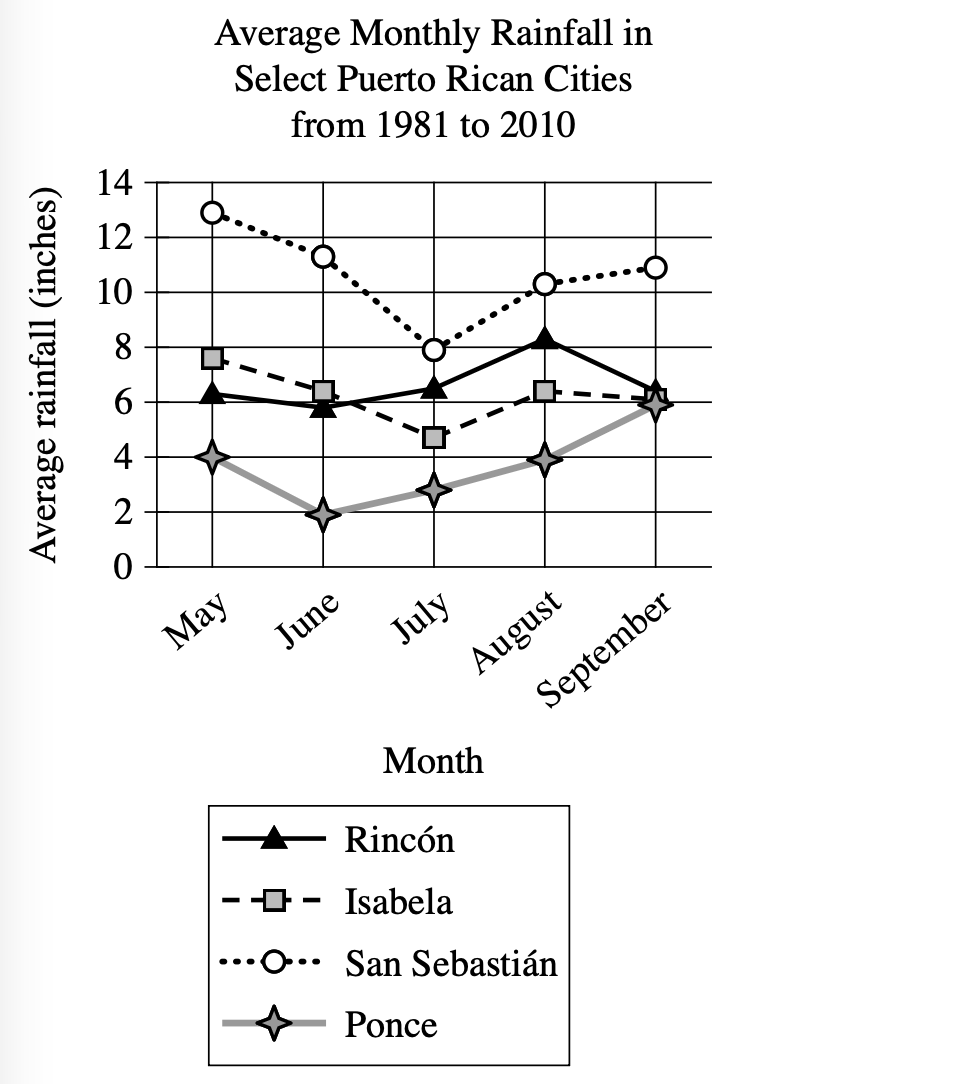
A student is presenting average monthly rainfall totals in various Puerto Rican cities for a science class. During the presentation, the student notes that in September ________
Which choice most effectively uses data from the graph to complete the statement?
Rincón's average rainfall is greater than that of Isabela, San Sebastián, and Ponce.
Rincón and Ponce have an average rainfall of about 5 inches, and Isabela and San Sebastián have an average rainfall of about 10 inches.
Rincón, Ponce, and Isabela each have an average rainfall below 8 inches, but San Sebastián's average rainfall that month is greater than 8 inches.
Rincón has a similar average rainfall to Isabela, and Ponce has a similar average rainfall to San Sebastián.
Step 1: Decode and Map All Source Material
Passage Analysis Table
| Text from Passage | Analysis |
|---|---|
| 'A student is presenting average monthly rainfall totals in various Puerto Rican cities for a science class.' |
|
| 'During the presentation, the student notes that in September ____' |
|
Visual Data Analysis
Visual Type & Title: Line graph - 'Average Monthly Rainfall in Select Puerto Rican Cities from 1981 to 2010'
What It Shows:
- X-axis: months (May through September)
- Y-axis: average rainfall (inches, 0-14 scale)
- Four cities tracked: Rincon, Isabela, San Sebastian, Ponce
- Time scope: 30-year average (1981-2010)
Key Observations:
- September data: Rincon approx. 6 inches, Isabela approx. 6 inches, San Sebastian approx. 11 inches, Ponce approx. 5 inches
- San Sebastian consistently highest rainfall (10-13 inch range)
- Ponce consistently lowest (2-6 inch range)
- Most cities show seasonal variation: higher in May/August, lower in June/July
Provide Passage Architecture & Core Elements
Main Point: A student needs to complete an observation about September rainfall patterns using data from the provided graph.
Argument Flow: The passage establishes a presentation context where a student is sharing rainfall data, then presents an incomplete statement about September that must be filled using specific evidence from the accompanying graph.
Step 2: Interpret the Question Precisely
This is a fill-in-the-blank question asking us to choose the best logical connector. The answer must create the right relationship between what comes before and after the blank.
Step 3: Prethink the Answer
- From our graph analysis, we know the September data points are:
- Rincon approx. 6 inches
- Isabela approx. 6 inches
- San Sebastian approx. 11 inches
- Ponce approx. 5 inches
- The correct answer must accurately reflect these measurements. Key elements it should have:
- Acknowledge that San Sebastian has noticeably higher rainfall (approx. 11 inches) compared to the other three cities
- Recognize that Rincon, Isabela, and Ponce cluster in the 5-6 inch range
- Use the actual data values rather than making unsupported generalizations
Rincón's average rainfall is greater than that of Isabela, San Sebastián, and Ponce.
✗ Incorrect
- Claims Rincon's rainfall is greater than all other cities in September
- Graph shows Rincon approx. 6 inches while San Sebastian approx. 11 inches
- Directly contradicts the visual evidence
Rincón and Ponce have an average rainfall of about 5 inches, and Isabela and San Sebastián have an average rainfall of about 10 inches.
✗ Incorrect
- States Rincon and Ponce have 'about 5 inches' and Isabela and San Sebastian have 'about 10 inches'
- Graph shows Rincon approx. 6 inches (not 5), Isabela approx. 6 inches (not 10)
- Misgroups the cities and provides inaccurate measurements
Rincón, Ponce, and Isabela each have an average rainfall below 8 inches, but San Sebastián's average rainfall that month is greater than 8 inches.
✓ Correct
- States Rincon, Ponce, and Isabela each have rainfall below 8 inches, but San Sebastian's is greater than 8 inches
- Graph data confirms: Rincon approx. 6 inches less than 8, Ponce approx. 5 inches less than 8, Isabela approx. 6 inches less than 8, San Sebastian approx. 11 inches greater than 8
- Perfectly matches our prethinking
Rincón has a similar average rainfall to Isabela, and Ponce has a similar average rainfall to San Sebastián.
✗ Incorrect
- Claims Rincon and Isabela are similar (correct: both approx. 6 inches), but also claims Ponce and San Sebastian are similar
- Graph shows Ponce approx. 5 inches while San Sebastian approx. 11 inches - these are dramatically different, not similar