A student is researching the Chinese government's 1992 shift to a market economy that emphasizes trade liberalization. One means of...
GMAT Information and Ideas : (Ideas) Questions
A student is researching the Chinese government's 1992 shift to a market economy that emphasizes trade liberalization. One means of trade liberalization involves expanding from ordinary imports into an emphasis on processing imports, which have two types: processing with assembly (in which a firm obtains raw materials from a foreign trading partner without payment and sells the final goods to that partner, charging for assembly) and processing with inputs (in which a firm expends capital to buy raw materials from a trading partner, processes them into final goods, and sells those goods to whichever trading partner it chooses). The student asserts that while initial efforts at trade liberalization were shaped by Chinese firms' limited capital, this situation resolved during the 2000s.
Which choice best describes data from the graph that support the student's assertion?
Processing imports with inputs were greater than both ordinary imports and processing imports with assembly in 2006.
From 2000 to 2006, processing imports with inputs rose much more sharply than processing imports with assembly did.
From 2000 to 2006, neither processing imports with inputs nor processing imports with assembly were greater than ordinary imports.
Processing imports with assembly were greater in 2006 than processing imports with inputs in 2000.
Step 1: Decode and Map All Source Material
Passage Analysis Table
| Text from Passage | Analysis |
|---|---|
| 'A student is researching the Chinese government's 1992 shift to a market economy that emphasizes trade liberalization.' |
|
| 'One means of trade liberalization involves expanding from ordinary imports into an emphasis on processing imports, which have two types:' |
|
| 'processing with assembly (in which a firm obtains raw materials from a foreign trading partner without payment and sells the final goods to that partner, charging for assembly)' |
|
| 'and processing with inputs (in which a firm expends capital to buy raw materials from a trading partner, processes them into final goods, and sells those goods to whichever trading partner it chooses)' |
|
| 'The student asserts that while initial efforts at trade liberalization were shaped by Chinese firms' limited capital, this situation resolved during the 2000s.' |
|
Visual Data Analysis
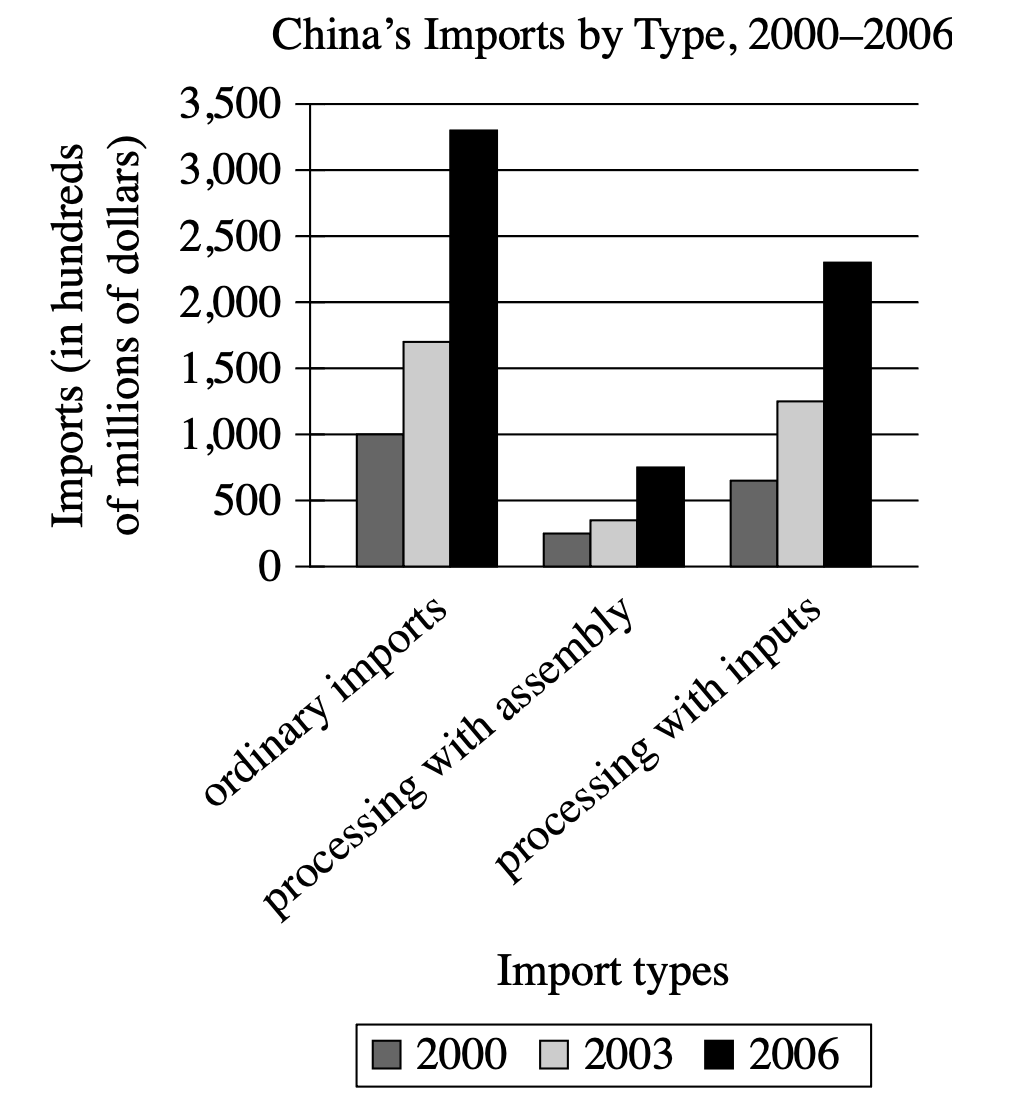
Visual Type & Title: Bar chart - 'China's Imports by Type, 2000-2006'
What It Shows: (Note format)
- 3 import categories: ordinary imports, processing w/ assembly, processing w/ inputs
- Units: hundreds of millions of dollars
- Years: 2000 (dark gray), 2003 (light gray), 2006 (black)
- Key data points:
- 2000: Ordinary ~1000, Assembly ~250, Inputs ~650
- 2003: Ordinary ~1700, Assembly ~350, Inputs ~550
- 2006: Ordinary ~3400, Assembly ~750, Inputs ~2300
Key Observations: (Note format)
- All categories increase over time
- Ordinary imports = highest in all years
- Processing w/ inputs: dramatic increase 2003→2006 (~550→~2300)
- Processing w/ assembly: steady increase but much smaller (~250→~750)
- Inputs growth >> Assembly growth (2000-2006)
Connection to Text: Graph quantifies the trade liberalization discussed in text, showing actual import volumes for the two processing types defined in the passage.
Step 2: Interpret the Question Precisely
What's being asked? We need to identify which data from the graph supports the student's assertion about limited capital being resolved in the 2000s.
What type of answer do we need? Specific evidence from the graph that would logically support the claim that capital limitations were resolved.
Any limiting keywords? 'data from the graph' - we must reference actual visual data, not just the text.
Step 3: Prethink the Answer
- The student's assertion is that Chinese firms initially had limited capital, but this was resolved in the 2000s
- Since processing with inputs requires firms to 'expend capital to buy raw materials' while processing with assembly gets materials 'without payment,' we'd expect to see evidence that processing with inputs grew more substantially than processing with assembly during the 2000s if capital constraints were indeed resolved
- From the graph, processing with inputs shows dramatic growth especially from 2003 to 2006 (roughly 550 to 2300 - more than quadrupling), while processing with assembly grows more modestly (250 to 750 - tripling)
- This pattern makes sense: as firms gained access to more capital, they could afford the upfront investment required for processing with inputs
- The right answer should highlight that processing with inputs (the capital-intensive option) grew much more dramatically than processing with assembly (the non-capital-intensive option) during the 2000s
Processing imports with inputs were greater than both ordinary imports and processing imports with assembly in 2006.
- Claims processing with inputs were greater than both other categories in 2006
- Graph shows: ordinary imports (\(\sim\mathrm{3400}\)) \(\gt\) processing with inputs (\(\sim\mathrm{2300}\)) \(\gt\) processing with assembly (\(\sim\mathrm{750}\)) in 2006
- Processing with inputs was NOT greater than ordinary imports
From 2000 to 2006, processing imports with inputs rose much more sharply than processing imports with assembly did.
- States processing with inputs rose much more sharply than processing with assembly from 2000-2006
- Graph data: Processing with inputs \(\sim\mathrm{650}\rightarrow\sim\mathrm{2300}\) (increase of \(\sim\mathrm{1650}\)); Processing with assembly \(\sim\mathrm{250}\rightarrow\sim\mathrm{750}\) (increase of \(\sim\mathrm{500}\))
- This dramatic difference supports the assertion - as capital became available, firms shifted toward the capital-intensive processing method
- Matches our prethinking perfectly
From 2000 to 2006, neither processing imports with inputs nor processing imports with assembly were greater than ordinary imports.
- Claims neither processing type exceeded ordinary imports from 2000-2006
- This is factually correct from the graph, but doesn't support the student's assertion about capital constraints being resolved
- Provides no evidence related to capital availability
Processing imports with assembly were greater in 2006 than processing imports with inputs in 2000.
- Compares processing with assembly in 2006 (\(\sim\mathrm{750}\)) to processing with inputs in 2000 (\(\sim\mathrm{650}\))
- While technically true, this comparison doesn't demonstrate anything about capital constraints being resolved
- Doesn't show the relative growth patterns that would indicate increased capital availability