A student is researching the trends in the topics submitted to a national science fair for high school students. The...
GMAT Information and Ideas : (Ideas) Questions
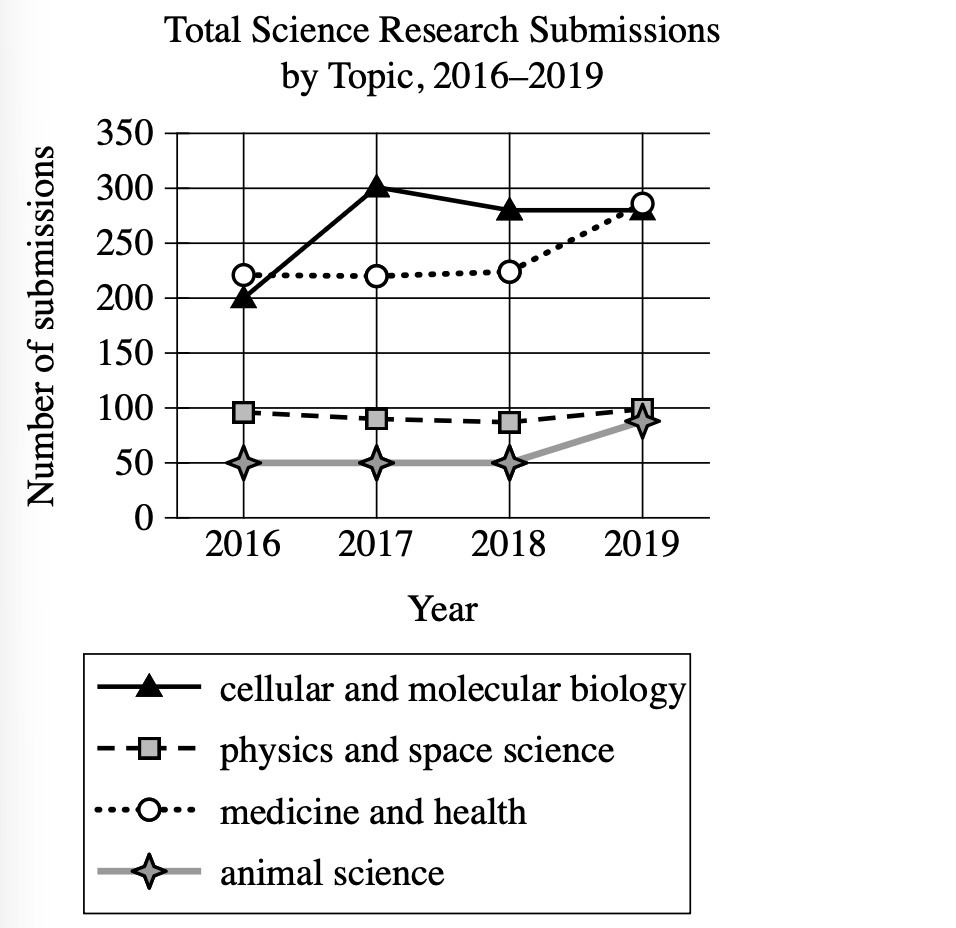
A student is researching the trends in the topics submitted to a national science fair for high school students. The graph shows the number of submissions by topic that were made each year. Based on the data in the graph, the student claims that there were more medicine and health research topics submitted in 2019 than in any other year.
In 2016, the number of cellular and molecular biology topic submissions was the same as the number of animal science topic submissions.
In 2019, there were more physics and space science topic submissions than there were medicine and health topic submissions.
The lowest number of animal science topic submissions in a year was approximately 95 in 2016.
The highest number of medicine and health topic submissions during the period shown is approximately 285 in 2019.
Step 1: Decode and Map All Source Material
Part A: Create Passage Analysis Table
| Text from Passage | Analysis |
|---|---|
| "A student is researching the trends in the topics submitted to a national science fair for high school students." |
|
| "The graph shows the number of submissions by topic that were made each year." |
|
| "Based on the data in the graph, the student claims that there were more medicine and health research topics submitted in 2019 than in any other year." |
|
Visual Data Analysis
Visual Type & Title: Line graph - "Total Science Research Submissions by Topic, 2016-2019"
What It Shows: X-axis shows years 2016-2019, Y-axis shows number of submissions 0-350, four topic lines with medicine/health data showing approximately 220 in 2016-2018, then jumping to 285 in 2019.
Key Observations: Medicine/health submissions remained flat around 220 from 2016-2018, then increased sharply to approximately 285 in 2019, which represents the highest point for this topic across all four years shown.
Part B: Provide Passage Architecture & Core Elements
Main Point: A student claims that 2019 had more medicine and health research submissions to a science fair than any other year in the period shown.
Text-Visual Synthesis: The passage presents a claim while the graph provides quantitative evidence showing medicine and health submissions peaked at approximately 285 in 2019.
Step 2: Interpret the Question Precisely
What's being asked? Which answer choice uses graph data to support the claim about medicine and health submissions being highest in 2019.
What type of answer do we need? A choice that references specific data from the graph that backs up the claim.
Any limiting keywords? N/A
Step 3: Prethink the Answer
- The correct answer needs to reference specific data from the graph confirming medicine and health submissions were highest in 2019
- From our analysis, we know these submissions were around 220 in 2016-2018, then jumped to approximately 285 in 2019
- The right answer should acknowledge this 2019 peak value
In 2016, the number of cellular and molecular biology topic submissions was the same as the number of animal science topic submissions.
- References 2016 data about cellular biology and animal science
- Completely irrelevant to the claim about medicine and health in 2019
In 2019, there were more physics and space science topic submissions than there were medicine and health topic submissions.
- Claims physics submissions exceeded medicine and health submissions in 2019
- Graph shows physics around 95-100 while medicine/health reached 285 in 2019, so this contradicts the data
The lowest number of animal science topic submissions in a year was approximately 95 in 2016.
- Discusses animal science submissions in 2016
- Has nothing to do with medicine and health submissions in 2019
The highest number of medicine and health topic submissions during the period shown is approximately 285 in 2019.
- States medicine and health reached approximately 285 submissions in 2019 and identifies this as the highest number during the period shown
- This directly supports the claim using specific graph data