By the early 1900s, the Singer Corporation, a US sewing machine manufacturer founded in 1851, began to see rapidly increasing...
GMAT Information and Ideas : (Ideas) Questions
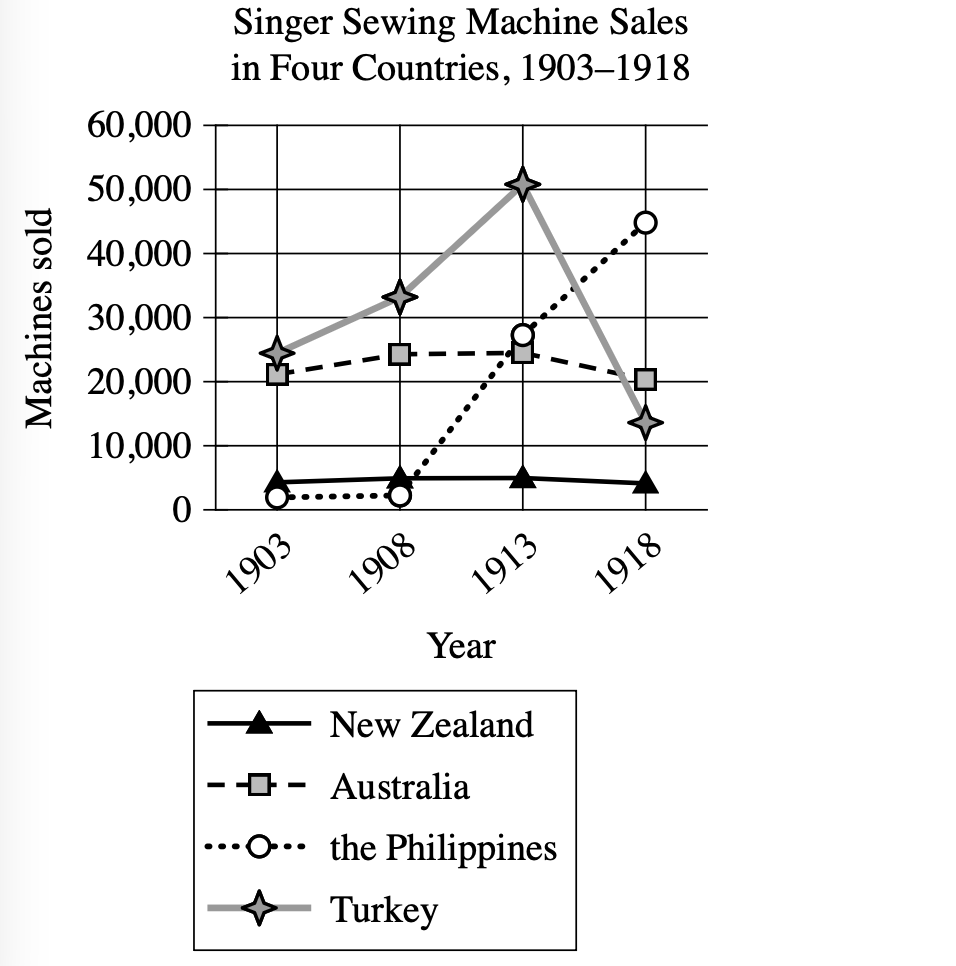
By the early 1900s, the Singer Corporation, a US sewing machine manufacturer founded in 1851, began to see rapidly increasing sales abroad, particularly in Russia, Germany, and the United Kingdom. These markets were responsible for the bulk of Singer's overseas sales, but demand for the company's machines in other countries also grew significantly in the early twentieth century. For instance, sales of their sewing machines in ______
Which choice most effectively uses data from the graph to complete the example?
the Philippines increased dramatically from 1908 to 1918.
New Zealand were largely consistent from 1903 to 1918.
Australia increased steadily from 1903 to 1918.
Turkey declined substantially from 1913 to 1918.
Step 1: Decode and Map All Source Material
Create Passage Analysis Table
| Text from Passage | Analysis |
|---|---|
| "By the early 1900s, the Singer Corporation, a US sewing machine manufacturer founded in 1851, began to see rapidly increasing sales abroad, particularly in Russia, Germany, and the United Kingdom." |
|
| "These markets were responsible for the bulk of Singer's overseas sales, but demand for the company's machines in other countries also grew significantly in the early twentieth century." |
|
| "For instance, sales of their sewing machines in ______" |
|
Visual Data Analysis:
Visual Type & Title: Line graph - "Singer Sewing Machine Sales in Four Countries, 1903–1918"
What It Shows: Y-axis: Machines sold (0-60,000 units), X-axis: Years (1903, 1908, 1913, 1918), Four countries tracked: New Zealand, Australia, Philippines, Turkey, Sales data across 15-year period
Key Observations:
- Philippines: dramatic ↑ (2K→27K→45K from 1903→1913→1918)
- Turkey: peak 1913 (51K) then crash ↓ (13K by 1918)
- Australia: slight ↑ then ↓ (22K→25K→20K)
- New Zealand: flat → consistent ~5K throughout
Connection to Text: Graph provides specific examples of "other countries" mentioned in text, showing quantified sales data that supports claim about growth in markets beyond Russia/Germany/UK.
Provide Passage Architecture & Core Elements
Main Point: Singer Corporation experienced international growth in the early 1900s, not just in major markets but also in other countries that showed significant demand increases.
Argument Flow: The passage establishes Singer's background, explains their overseas expansion focusing on major markets, then transitions to note that other countries also experienced significant growth, leading to a specific example that needs completion.
Text-Visual Synthesis: The text discusses Singer's international expansion generally and mentions "other countries" experiencing significant growth, while the graph provides concrete data for four specific countries that quantifies various growth patterns from 1903-1918.
Step 2: Interpret the Question Precisely
This is a fill-in-the-blank question asking us to choose the best logical connector. The answer must create the right relationship between what comes before and after the blank.
Step 3: Prethink the Answer
- The right answer should describe a sales pattern that actually matches what the graph shows for one of the four countries
- Support the text's claim that "other countries also grew significantly" or provide a contrasting example that still fits the "for instance" structure
- Use specific language that aligns with the visual data trends
- Looking at the graph data: Philippines shows massive increase from ~2K (1903) to ~45K (1918)
- Turkey peaked in 1913 (~51K) then dropped substantially to ~13K (1918)
- Australia shows modest fluctuations with slight overall decline
- New Zealand remained consistently low throughout
the Philippines increased dramatically from 1908 to 1918.
- Describes Philippines increasing "dramatically from 1908 to 1918"
- Graph shows Philippines: \(\sim\mathrm{3K}\,(1908) \rightarrow \sim\mathrm{27K}\,(1913) \rightarrow \sim\mathrm{45K}\,(1918)\) = dramatic increase
- Perfectly matches visual data and supports text's claim about significant growth in other countries
New Zealand were largely consistent from 1903 to 1918.
- Claims New Zealand sales were "largely consistent from 1903 to 1918"
- Graph shows New Zealand stayed around 5K throughout, which is accurate but doesn't effectively complete the "for instance" example since consistent sales don't illustrate the "significant growth" claim from the text
Australia increased steadily from 1903 to 1918.
- Claims Australia sales "increased steadily from 1903 to 1918"
- Graph shows Australia: \(\sim\mathrm{22K}\,(1903) \rightarrow \sim\mathrm{25K}\,(1908) \rightarrow \sim\mathrm{20K}\,(1918)\)
- This contradicts the graph data as Australia actually declined overall, not increased steadily
Turkey declined substantially from 1913 to 1918.
- Claims Turkey sales "declined substantially from 1913 to 1918"
- Graph shows Turkey: \(\sim\mathrm{51K}\,(1913) \rightarrow \sim\mathrm{13K}\,(1918)\) = substantial decline
- While factually accurate, doesn't effectively complete the example supporting "significant growth" in other countries