Copper had been mined in the US for thousands of years, but large-scale commercial mining of copper took off starting...
GMAT Information and Ideas : (Ideas) Questions
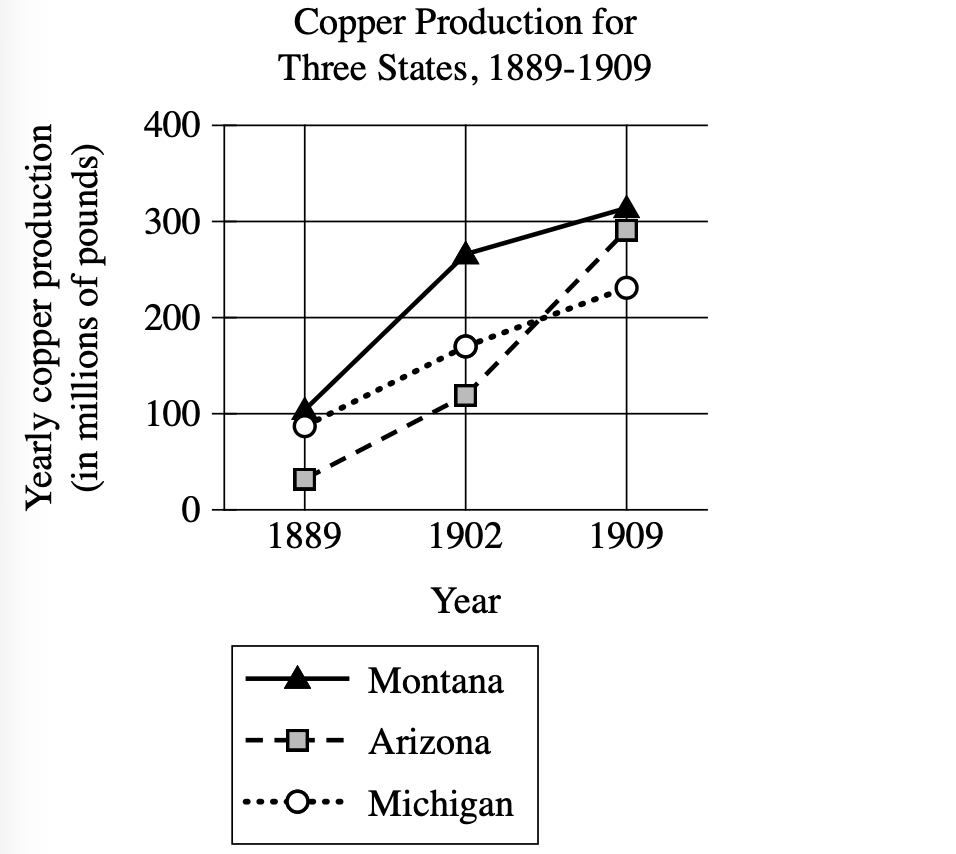
Copper had been mined in the US for thousands of years, but large-scale commercial mining of copper took off starting in the late 1800s. This was due to several factors. Technological advancements in the mining industry led to improvements in the production of copper. This helped the country keep up with the growing number of people wanting to buy copper starting in the 1890s. At the same time, the growth of the railroad system made the transportation of copper in large batches much easier. Several states saw rapid growth in the production of this resource, for example: ______
Which choice most effectively uses the data in the graph to complete the example?
The rise in copper production in Michigan slowed from 1902 to 1909.
Montana and Arizona produced more copper than Michigan did in 1909.
Fewer than 100 million pounds of copper were produced in Arizona in 1889.
Copper production rose significantly from 1889 to 1909 for Arizona, Michigan, and Montana.
Step 1: Decode and Map All Source Material
Part A: Passage Analysis Table
| Text from Passage | Analysis |
|---|---|
| "Copper had been mined in the US for thousands of years, but large-scale commercial mining of copper took off starting in the late 1800s." |
|
| "This was due to several factors." |
|
| "Technological advancements in the mining industry led to improvements in the production of copper." |
|
| "This helped the country keep up with the growing number of people wanting to buy copper starting in the 1890s." |
|
| "At the same time, the growth of the railroad system made the transportation of copper in large batches much easier." |
|
| "Several states saw rapid growth in the production of this resource, for example:" |
|
Visual Data Analysis
Visual Type & Title: Line graph titled "Copper Production for Three States, 1889-1909"
What It Shows:
- Y-axis: Yearly copper production (millions of pounds), 0-400 range
- X-axis: Years (1889, 1902, 1909)
- Three states tracked: Montana (solid line), Arizona (dashed line), Michigan (dotted line)
- Production volumes over 20-year period
Key Observations:
- All states show upward trend 1889 to 1909
- Montana: 100 to 270 to 310 (steady growth)
- Arizona: 35 to 115 to 290 (dramatic increase, especially 1902 to 1909)
- Michigan: 85 to 165 to 230 (consistent increase)
- Arizona shows steepest growth rate overall
- All end above 200M lbs by 1909
Connection to Text:
Graph provides specific quantitative evidence for "rapid growth" claim in passage about "several states"
Part B: Passage Architecture & Core Elements
Main Point: Large-scale commercial copper mining took off in the late 1800s due to technological advances and railroad development, leading to rapid production growth in several states.
Argument Flow: The passage establishes that while copper mining is ancient, commercial-scale mining began in the late 1800s. It then explains this growth through two key factors: technological improvements that boosted production to meet rising 1890s demand, and railroad expansion that facilitated bulk transportation. The passage concludes by noting that several states experienced rapid production growth, setting up the need for a specific data-supported example.
Text-Visual Synthesis: The text makes a general claim about "several states" experiencing "rapid growth" in copper production, while the graph provides specific quantitative evidence showing Montana, Arizona, and Michigan all dramatically increased production from 1889-1909, with some states tripling or more their output.
Step 2: Interpret the Question Precisely
This is a fill-in-the-blank question asking us to choose the best logical connector. The answer must create the right relationship between what comes before and after the blank.
Step 3: Prethink the Answer
- The passage claims that "several states saw rapid growth" in copper production, so our answer needs to use specific graph data to demonstrate this
- Looking at our visual analysis, all three states showed substantial increases: Montana went from approximately 100 to 310 million pounds (tripled), Arizona from 35 to 290 (more than 8x increase), and Michigan from 85 to 230 (almost tripled) between 1889 and 1909
- The right answer should reference multiple states and use the actual data to show significant production increases over the time period
- It should directly support the "rapid growth" claim with specific evidence from the graph
The rise in copper production in Michigan slowed from 1902 to 1909.
✗ Incorrect
- Claims Michigan's growth "slowed from 1902 to 1909"
- Graph shows Michigan: 1902 (165) to 1909 (230) - still substantial growth
- Focuses on growth rate change rather than overall rapid growth
- Doesn't effectively illustrate "several states" or use data to support "rapid growth" claim
Montana and Arizona produced more copper than Michigan did in 1909.
✗ Incorrect
- Makes comparison between states' final 1909 production levels
- True that Montana (310) and Arizona (290) exceeded Michigan (230) in 1909
- Misses the point - doesn't demonstrate "rapid growth" over time
- Shows end-point comparison, not growth trend that supports passage claim
Fewer than 100 million pounds of copper were produced in Arizona in 1889.
✗ Incorrect
- States Arizona produced under 100 million pounds in 1889 (true - 35 million)
- Only references starting point for one state
- Doesn't demonstrate growth over time or involve "several states"
- Completely fails to illustrate the "rapid growth" example the passage needs
Copper production rose significantly from 1889 to 1909 for Arizona, Michigan, and Montana.
✓ Correct
- References all three states shown in graph ("Arizona, Michigan, and Montana")
- Uses phrase "rose significantly from 1889 to 1909" - directly matches timeframe
- Graph data supports this: Montana (100 to 310), Arizona (35 to 290), Michigan (85 to 230)
- Perfectly completes the "several states saw rapid growth" example with specific evidence