Electric companies that use wind turbines rely on weather forecasts to predict the maximum amount of power, in megawatt-hours (MWh),...
GMAT Information and Ideas : (Ideas) Questions
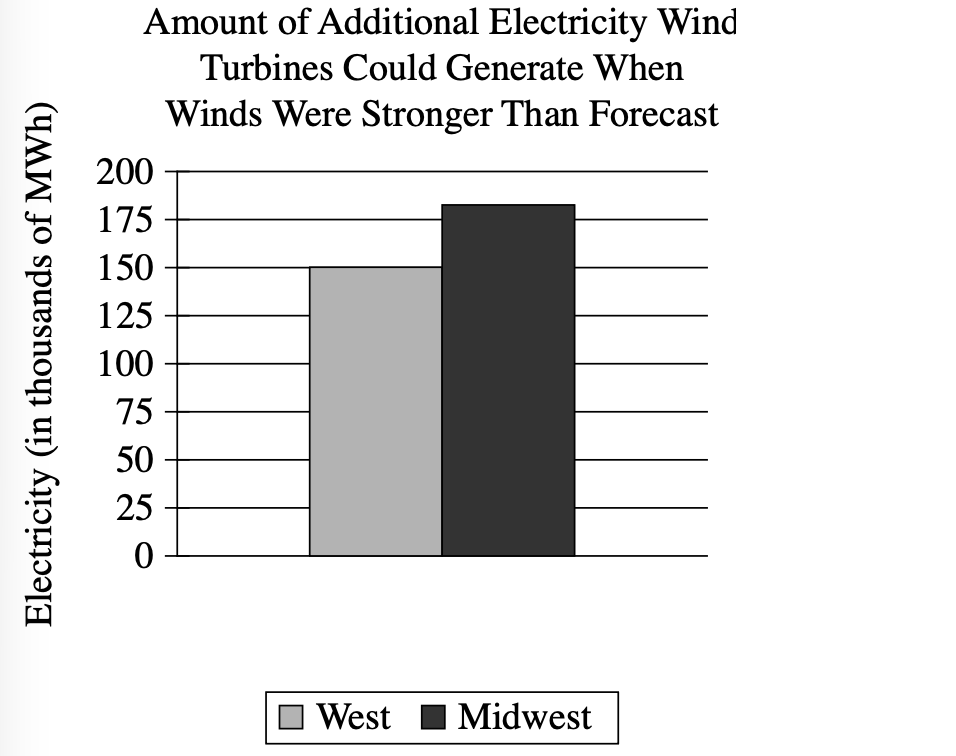
Electric companies that use wind turbines rely on weather forecasts to predict the maximum amount of power, in megawatt-hours (MWh), they can generate using wind so that they can determine how much they'll need to generate from other sources. When winds are stronger than they were forecast to be, however, the predicted maximum amount of electricity wind turbines could generate will be too low. For example, the graph shows that for the West region, the winds were ______
Which choice most effectively uses data from the graph to complete the example?
strong enough to generate about 150 thousand more MWh of electricity from wind turbines.
so weak that the electricity from wind turbines was about 175 thousand MWh less than predicted.
so weak that the electricity from wind turbines was about 150 thousand MWh less than predicted.
strong enough to generate about 175 thousand more MWh of electricity from wind turbines.
Step 1: Decode and Map All Source Material
Passage Analysis Table:
| Text from Passage | Analysis |
|---|---|
| "Electric companies that use wind turbines rely on weather forecasts to predict the maximum amount of power, in megawatt-hours (MWh), they can generate using wind so that they can determine how much they'll need to generate from other sources." |
|
| "When winds are stronger than they were forecast to be, however, the predicted maximum amount of electricity wind turbines could generate will be too low." |
|
| "For example, the graph shows that for the West region, the winds were ______" |
|
Visual Data Analysis:
- Visual Type & Title: Bar chart - "Amount of Additional Electricity Wind Turbines Could Generate When Winds Were Stronger Than Forecast"
- What It Shows: (Note format)
- Y-axis: Electricity (thousands of MWh), scale 0-200
- Two regions: West, Midwest
- West bar: ~150 thousand MWh
- Midwest bar: ~185 thousand MWh
- Shows additional electricity possible when actual winds > forecast
- Key Observations: (Note format)
- Midwest > West (185 vs 150 approx)
- Both positive values = both had stronger winds than forecast
- West: ~150K MWh additional possible
- Midwest: ~185K MWh additional possible
- Connection to Text: The graph provides the specific example data for the West region that the passage is setting up in its final sentence.
Step 2: Interpret the Question Precisely
This is a fill-in-the-blank question asking us to choose the best logical connector. The answer must create the right relationship between what comes before and after the blank.
Step 3: Prethink the Answer
- Looking at the graph, the West region shows approximately 150 thousand MWh of additional electricity that could have been generated when winds were stronger than forecast
- The context is about winds being "stronger than they were forecast to be" leading to predictions being "too low"
- We need an answer that references the West region specifically, uses the ~150 thousand MWh figure from the graph, indicates that winds were stronger than expected, and shows this as additional generation capacity
strong enough to generate about 150 thousand more MWh of electricity from wind turbines.
✓ Correct
- States winds were "strong enough to generate about 150 thousand more MWh"
- Perfectly matches the graph data for West region (~150K MWh)
- Fits the logical context of stronger winds meaning more generation capacity
- Uses "more" correctly to indicate additional electricity beyond forecast
so weak that the electricity from wind turbines was about 175 thousand MWh less than predicted.
✗ Incorrect
- Claims winds were "so weak that electricity was about 175 thousand MWh less than predicted"
- Contradicts the graph which shows positive additional generation, not a deficit
- Wrong number and wrong direction
so weak that the electricity from wind turbines was about 150 thousand MWh less than predicted.
✗ Incorrect
- Claims winds were "so weak that electricity was about 150 thousand MWh less than predicted"
- Right number (150K) but wrong interpretation
- Graph shows additional generation possible, not less generation
strong enough to generate about 175 thousand more MWh of electricity from wind turbines.
✗ Incorrect
- States winds were "strong enough to generate about 175 thousand more MWh"
- Right direction but wrong number
- Graph shows ~185K for Midwest, ~150K for West - this mixes up the regions