Considering a large sample of companies, economics experts Maria Guadalupe, Julie Wulf, and Raghuram Rajan assessed the number of managers...
GMAT Information and Ideas : (Ideas) Questions
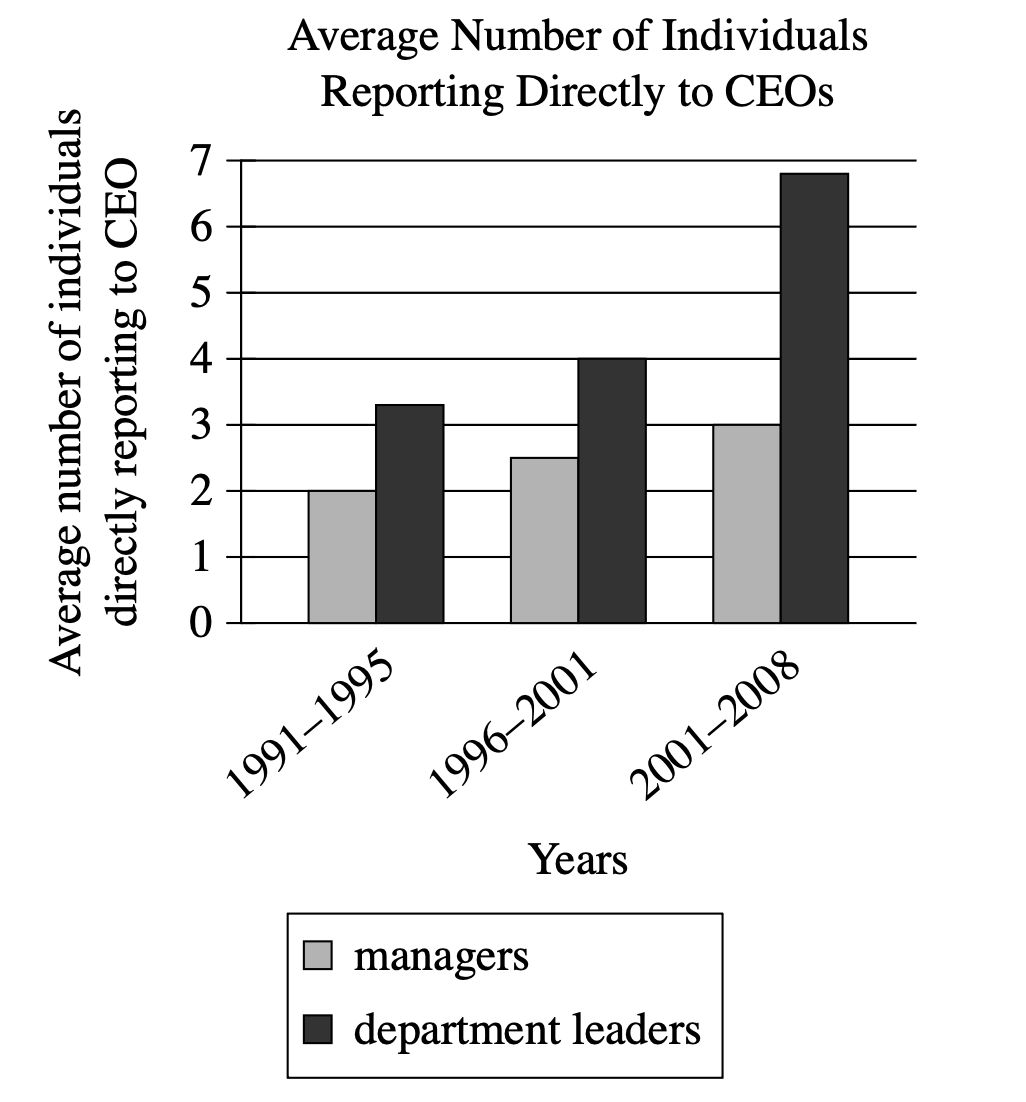
Considering a large sample of companies, economics experts Maria Guadalupe, Julie Wulf, and Raghuram Rajan assessed the number of managers and leaders from different departments who reported directly to a chief executive officer (CEO). According to the researchers, the findings suggest that across the years analyzed, there was a growing interest among CEOs in connecting with more departments in their companies.
Which choice best describes data from the graph that support the researchers' conclusion?
The average numbers of managers and department leaders reporting directly to their CEO didn't fluctuate from the 1991–1995 period to the 2001–2008 period.
The average number of managers reporting directly to their CEO was highest in the 1996–2001 period.
The average number of department leaders reporting directly to their CEO was greater than the average number of managers reporting directly to their CEO in each of the three periods studied.
The average number of department leaders reporting directly to their CEO rose over the three periods studied.
Step 1: Decode and Map All Source Material
Passage Analysis Table
| Text from Passage | Analysis |
|---|---|
| 'Considering a large sample of companies, economics experts Maria Guadalupe, Julie Wulf, and Raghuram Rajan assessed the number of managers and leaders from different departments who reported directly to a chief executive officer (CEO).' |
|
| 'According to the researchers, the findings suggest that across the years analyzed, there was a growing interest among CEOs in connecting with more departments in their companies.' |
|
Visual Data Analysis
- Visual Type & Title: Bar chart - 'Average Number of Individuals Reporting Directly to CEOs'
- What It Shows: (Note format)
- X-axis: 3 time periods (1991-1995, 1996-2001, 2001-2008)
- Y-axis: Average number of individuals (scale 0-7)
- Two categories: managers (gray bars), department leaders (dark bars)
- Units: Average number of people reporting directly to CEO
- Key Observations: (Note format)
- Managers: ~2 (1991-95) → ~2.5 (1996-01) → ~3 (2001-08) [gradual increase]
- Dept leaders: ~3.3 (1991-95) → ~4 (1996-01) → ~6.8 (2001-08) [strong increase]
- Dept leaders > managers across all periods
- Both categories show upward trends, dept leaders more dramatic
- Connection to Text: Graph quantifies the 'growing interest' claim with specific numerical increases over time
Part B: Provide Passage Architecture & Core Elements
Visual Structure Map:
[RESEARCH SETUP] leads to [MAIN CONCLUSION] CEOs showed growing interest in connecting with departments over timeMain Point: Research found that CEOs showed growing interest in connecting with more departments over the analyzed time period.
Argument Flow: Brief passage introduces the researchers and methodology, then presents their key finding about increasing CEO-department connections.
Text-Visual Synthesis: The text provides the researchers' general conclusion about 'growing interest,' while the graph offers specific quantitative evidence showing increases in direct reports to CEOs, particularly dramatic growth in department leaders (from ~3.3 to ~6.8) across three time periods.
Step 2: Interpret the Question Precisely
What's being asked? Which specific data from the graph provides evidence for the researchers' conclusion
What type of answer do we need? A description of graph data that demonstrates the 'growing interest' trend
Any limiting keywords? 'data from the graph' - must reference specific visual information; 'support' - must connect to researchers' conclusion
Step 3: Prethink the Answer
- The researchers concluded there was 'growing interest among CEOs in connecting with more departments' - so we need data showing increases over time
- Connecting with more departments would involve having more department representatives report directly to the CEO
- From our graph analysis, department leaders showed strong upward growth: ~3.3 → ~4 → ~6.8 across the periods
- This increasing trend would directly support the conclusion about growing CEO interest
- The right answer should identify an upward trend in the graph data that demonstrates CEOs connecting with more people or departments over the studied time periods
The average numbers of managers and department leaders reporting directly to their CEO didn't fluctuate from the 1991–1995 period to the 2001–2008 period.
✗ Incorrect
- Claims the numbers 'didn't fluctuate' from 1991-1995 to 2001-2008
- Contradicts graph data showing clear increases: managers \(\sim 2 \rightarrow \sim 3\), dept leaders \(\sim 3.3 \rightarrow \sim 6.8\)
- Opposite of what supporting evidence should show
The average number of managers reporting directly to their CEO was highest in the 1996–2001 period.
✗ Incorrect
- States managers were 'highest in the 1996-2001 period'
- Graph shows managers continuously increasing: lowest (\(\sim 2\)) in 1991-95, middle (\(\sim 2.5\)) in 1996-01, highest (\(\sim 3\)) in 2001-08
- Misrepresents the actual trend
The average number of department leaders reporting directly to their CEO was greater than the average number of managers reporting directly to their CEO in each of the three periods studied.
✗ Incorrect
- Claims department leaders > managers 'in each of the three periods'
- While factually true from graph, this shows a consistent relationship, not growth
- Students might choose this because it's accurate graph information, but it doesn't demonstrate the 'growing' trend that supports the researchers' conclusion
The average number of department leaders reporting directly to their CEO rose over the three periods studied.
✓ Correct
- States department leaders 'rose over the three periods studied'
- Matches graph data perfectly: \(\sim 3.3\) (1991-95) \(\rightarrow\) \(\sim 4\) (1996-01) \(\rightarrow\) \(\sim 6.8\) (2001-08)
- This upward trend directly supports the conclusion about 'growing interest among CEOs in connecting with more departments'
- Department leaders represent different departmental connections, so their increase demonstrates the researchers' finding